Case 1E S-Curve Load Ramp

Contents
The overshoot in the stress at time t=1.0 is due in part to the instantaneous change from a surface load increasing at constant rate to a constant surface load. This effect can be minimized by utilizing a nonlinear amplitude curve where there is a smoother transition from increasing load to constant load; e.g. an S-Curve ramp.
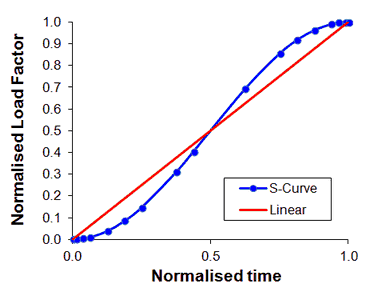
The S-Curve provides a smoother transition of the loading state at both the start and end of the load increase.
Data File |
|
*AMPLITUDE, TYPE=S-CURVE, NAME=LOADING_CURVE 0.0000, 0.0000 1.0000, 1.0000
|
The amplitude curve TYPE is set to S-CURVE. |
The equivalent ParaGeo data structure generated is Time_curve_data with the Curve_type set to 2
Data File |
|
* Time_curve_data NUM=1 ! --------------------------------- Time_curve IDM=2 0.0000 1.0000 Load_factor IDM=2 0.0000 1.0000 Curve_type 2
|
The Curve_type is set to 2 (smooth non-linear S-curve). |
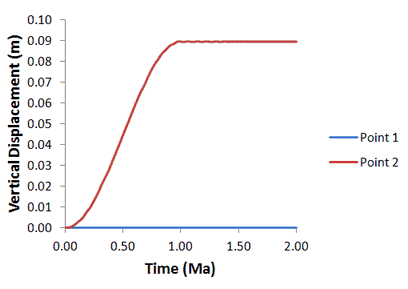
The results are visualized by plotting the high definition history data for global energy and points output in files mech_001_2d_Case1e_000.hdh and mech_001_2d_Case1e_001.hdh respectively.
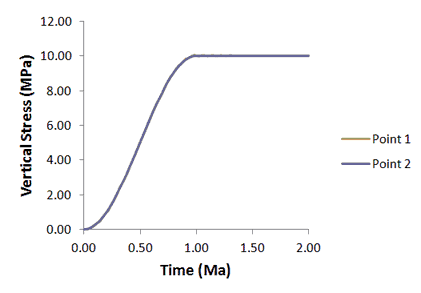
The time history of stress shows that the S-Curve ramp reduces the overshoot at time t=1.0 relative to the linear ramp case (Case 1D).
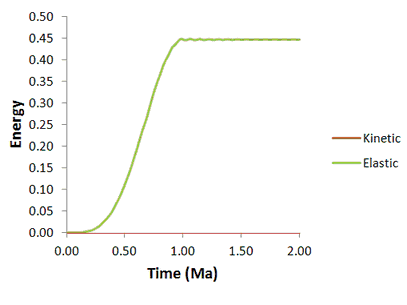
All curves exhibit only minor dynamic oscillations and the solution is close to quasi-static. Decreasing the critical time step further would further reduce the amplitude of the oscillations at the expense of greater CPU time.