Case01 Heat Transfer in Ma and Seconds
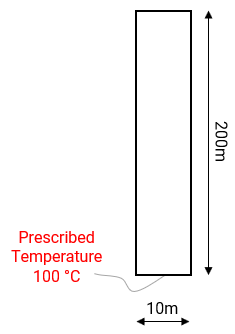
This example demonstrates heat transfer in model time units of "Ma" and "seconds" for a uniaxial column (10m x 100m) with an instantaneous prescribed temperature at the base of 100 °C. The distribution of temperature up the column after a time period of 100years is compared for input data file in two different time units - Ma and seconds. For the Ma time units, two subset data are investigated - thermal units input either in Joules or in Watts. Units of the model for stress, length, time and temperature are MPa, m, Ma or seconds and Celsius respectively. Note that the thermal units and thermal input data must be manually scaled in the model time units defined for the example. ParaGeo does not scale this automatically.
The three cases investigated are :
1.Case01a - Input data in "Ma" time units and thermal units in "Joules".
2.Case01b - Input data in "Ma" time units and thermal units in "Watts".
3.Case01c - Input data in "seconds" time units.
The data files for the project are in directory: ParaGeo Examples\General Examples\Ex_007\Case01\Data.
|
|
Model Definition |
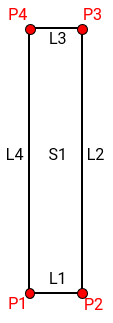
Geometry |
The tables below showing the thermal material input data for shale and water in the different time units.
Material Properties
The principal thermal parameters for shale material are:
|
Fluid Properties
The principal parameters for the pore fluid "water" are:
|
| Results |
The result files for the project are in directory: ParaGeo Examples\General Examples\Ex_007\Case01\Results.
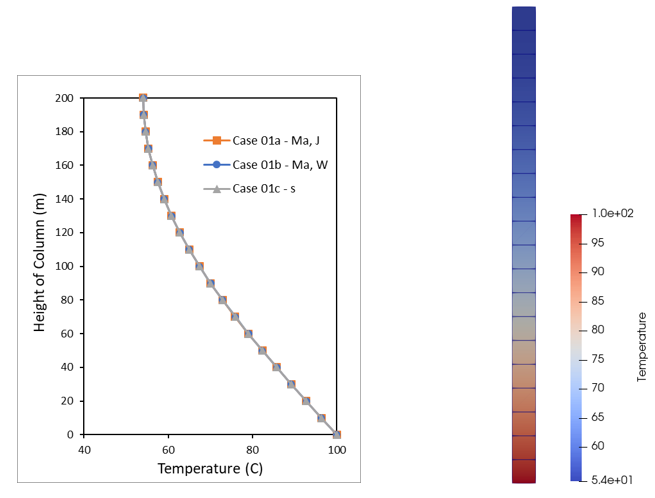
The temperature distribution up the column height for the different time input data units at the end of the 100 years duration should be the same - this is observed in the history section line plot at the end of the simulation.
Temperature distribution along the uniaxial column height for the three simulation cases.
|


