Overview
Hydrocarbon Maturation Overview
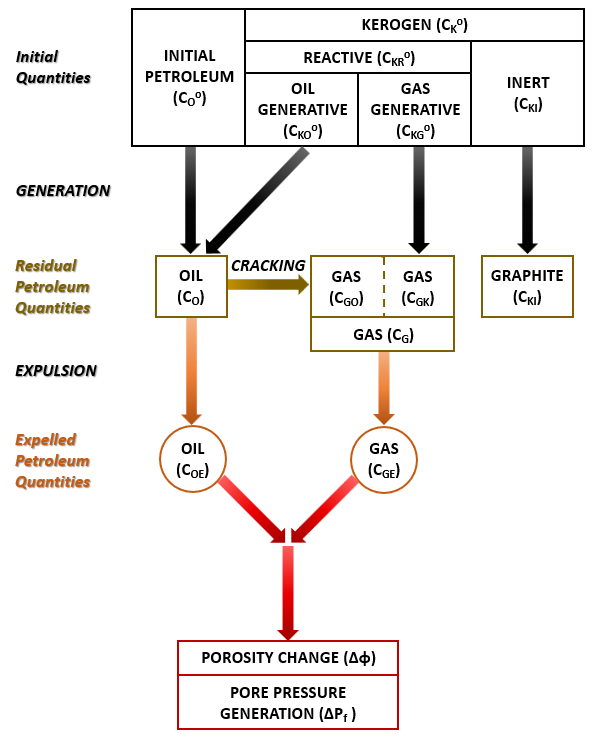
In ParaGeo, the five processes (1) petroleum generation, (2) cracking, (3) expulsion, (4) porosity change and (5) pore pressure generation required to compute the potential petroleum charge expelled from source rock are described in the flow chart shown below. These five processes are described in three main sections:
1Generation of oil and gas from sedimentary organic matter (SOM)
2Oil -> Gas cracking
3Expulsion - incorporates Expulsion of oil and gas + Porosity change + Pore pressure generation
.

Scheme of petroleum generation, cracking, expulsion, porosity change and pore pressure generation
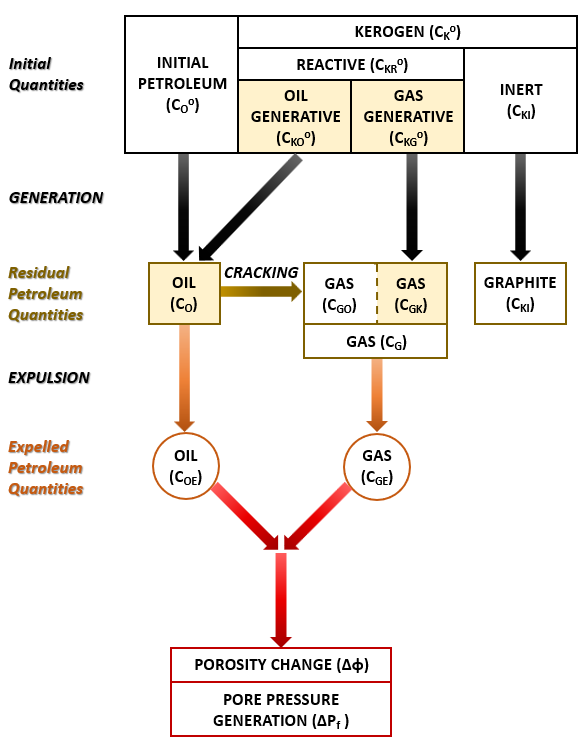
This involves the kerogen -> oil and kerogen -> gas generation processes as highlighted in the flow chart below.
The initial organic carbon in immature source rocks due to pyrolysis can be categorized into initial oil and kerogen components. The kerogen components comprise of inert kerogen and reactive kerogen, i.e. oil generative and gas generative, the latter contributing to hydrocarbon (oil and gas) generation. Hydrocarbon generation from kerogen can be classed into five pre-defined kerogen types defined by the organofacies A - F presented by Pepper and Corvi (1995a) (see Table). These are broadly characterized by specific organic matter and diagenetic influence related to depositional environment and stratigraphic age.
The Arrhenius kinetic model has been adopted by Pepper and Corvi (1995a) to simulate the kerogen -> oil and kerogen -> gas conversion. Separate default kinetic parameters (pre-multiplier A0, activation energy Emean and variance σ) for the oil generative and gas generative fractions of the kerogen for each of the five organofacies have been derived.
Hydrocarbon generation due to pyrolysis is dependent on: •TOC = Total organic carbon content •S1 = the amount of free hydrocarbons (gas and oil) in the sample. •S2 = the amount of hydrocarbons generated through thermal cracking of non-volatile organic matter. •W = weight fraction of carbon in hydrocarbons. •G = ratio of gas generated relative to oil.
From the above, the equivalent fractional carbon concentrations relative to the initial total carbon mass can be defined for the intial oil and kerogen components - oil generative, gas generative and inert. Key indices for hydrocarbon index (HI = S2/TOC) and transformation ratio* (TR = S1/TOC) are also formulated where HI provides an indication of the reactive to inert kerogen proportions in the sedimentary organic matter. Pepper and Corvi (1995a) has derived default kerogen kinetic parameters for TR, HI, G and W for each of the organofacies A - F.
* Transformation ratio TR is also referred to as Transformation index TI in the manual.
|
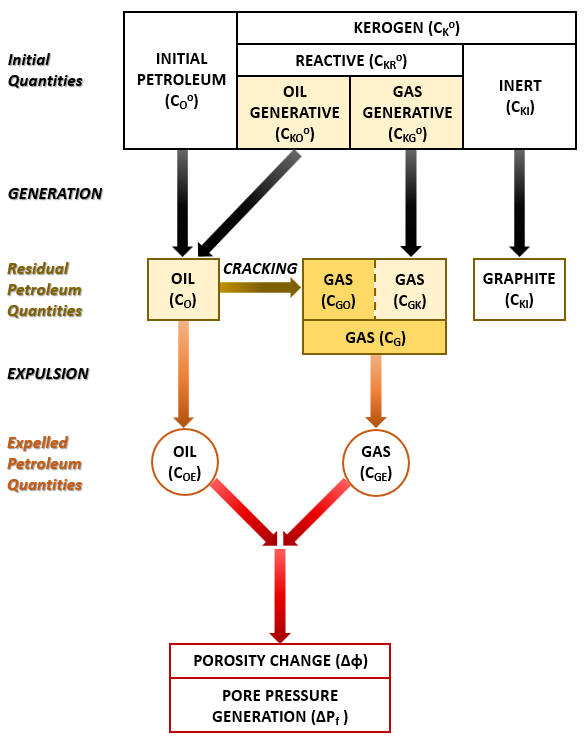
This involves the oil -> gas cracking process as highlighted in the flow chart below.
Initial oil and generated oil may be transformed to gas through secondary cracking which is highly dependent on oil composition, primarily the saturate to aromatic ratio of the generated oil. The hydrocarbon index (HI) of the source rock, reflecting indirectly the saturate to aromatic ratio of the generated oil, can be correlated with the rate constants for oil cracking, thus allowing prediction of cracking rates based on knowledge of a simple routinely performed geochemical measurement. To this end, Pepper and Dodd (1995) have provided default kinetic parameters for the oil -> gas cracking process based on a HI-dependent Gaussian distribution of a multicomponent parallel reaction law. Note that the same default oil -> gas cracking kinetic parameters apply to the five organofacies.
|
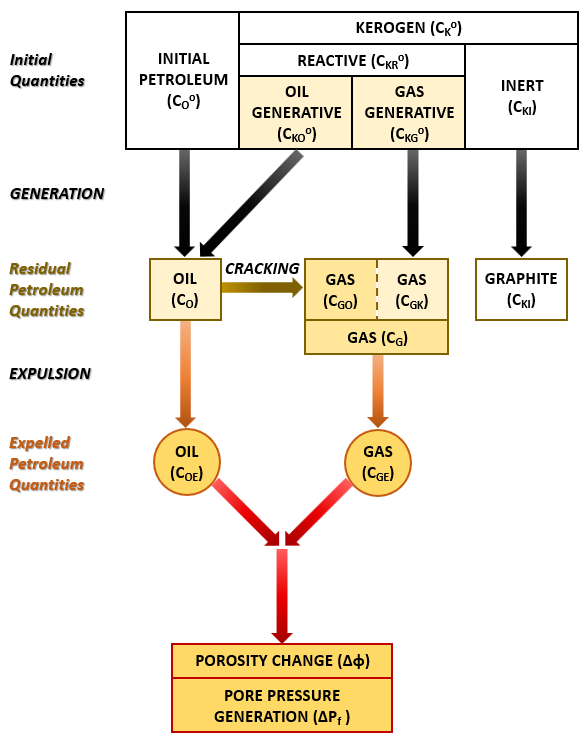
This involves the expulsion of oil and gas and the consequential porosity change and pore pressure generation as highlighted in the flow chart below.
Hydrocarbon Expulsion (Pepper and Corvi, 1995(b)) Oil and gas from the generation and oil -> gas cracking processes are retained (adsorbed) within the kerogen until their concentrations exceed the respective sorptive capacity of the residual organic carbon. Due to a lack of firm experimental evidence, Pepper and Corvi (1995b) assume global constants for these as aO =0.10g/gC and aG =0.02g/gC. Expulsion is the process by which hydrocarbon is released from kerogen within the source rock.
Porosity Update due to Kerogen Transformation This transformation is assumed to occur when the hydrocarbon is expelled from the kerogen and transferred to the fluid phase. Geomechanically, the kerogen is contained within the material matrix and defined by the TOC as a weight percentage of the original rock matrix. The transformation of kerogen to hydrocarbon results in a change in porosity of the source rock equal to the change in volume fraction of kerogen. Noting that the density of kerogen is c.a. 1200 kg/m3 and typical average grain density of shales of Carbonates is c.a. 2500kg/m3, the % volume associated with the kerogen transformation is twice the % weight TOC. For example, if TOC of kerogen is defined as 8% and assuming c.a. 50% transformation into fluid phase, if both kerogen and grain density were the same, this would give an additional 4% pore space. However, since kerogen density is c.a. half that of grain density, the additional transformation volume would equate to double, i.e. 8% pore space.
Pore Pressure Volume Generation Pore pressure generation occurs at the same time as the porosity change when the hydrocarbon is expelled from the kerogen and transferred to the fluid phase (liquid oil and gas). This transformation results in an increase in fluid volume because kerogen (c.a. 1200 kg/m3) is generally denser than hydrocarbon (c.a. 900kg/m3).
|
References
•Sweeney. J. J. and Burnham. A. K. (1990), Evaluation of a simple model of vitrinite reflectance based on chemical kinetics. AAPG Bulletin. 74. 1559-1570.
•Pepper, A.S. and Corvi, P.J. (1995(a)), Simple kinetic models of petroleum formation. Part I: oil and gas generation from kerogen. Marine and Petroleum Geology. 12(3) 291-319. 1995(a)
•Pepper, A.S., Dodd, T.A. (1995), Simple kinetic models of petroleum formation. Part II: oil-gas cracking. Marine and Petroleum Geology. 12(3) 321-340.
•Pepper, A.S. and Corvi, P.J. (1995(b)), Simple kinetic models of petroleum formation. Part III: Modelling an open system. Marine and Petroleum Geology. 12(4) 417-452.


