Case 2 - 8% shortening at strain rate of 0.04/Ma
In this exercise a lower displacement rate for the tectonic event will be considered (strain rate of 0.04/Ma) with the expectancy of a lesser overpressure than Case1. This will be achieved by considering the same amount of shortening over a longer time period of 2.0Ma. To this end, the usage of restart files will be employed, thus eliminating the need to rerun the sedimentation stages again.
To perform this exercise it is required:
1.To copy the "hm_005_Case1_stage_11.rst" generated after deposition of the last layer from the previous example into a new folder.
2.Copy the restart datafile to the new folder and then modify it as shown below.
Data File |
|
* Restart_Read_data ! --------------------------------- Restart_file_name "hm_005_Case1_stage_11.rst"
!--------------------------------------------------- ! Stage 12 Tectonic displacement !---------------------------------------------------
* Global_loads NUM=1 ! --------------------------------- Name "Displacement" Prescribed_displacement IDM=2 JDM=1 /Set 1/ -80.0 0.0 Pres_displacement_geom_set IDM=1 "East" Pres_displacement_geom_ass IDM=1 1
* Time_curve_data NUM=1 ! --------------------------------- Name "Displacement" Time_curve IDM=2 44.0 46.0 Load_factor IDM=2 0.0 1.0
* Load_case_control_data ! --------------------------------- Loadcases IDM=1 1 Active_load_flags IDM=1 2
* Control_data ! --------------------------------- Control_title "Compression" Solution_algorithm 4 Target_number_time_steps 200 Duration 2.0 Initial_time_increment 0.002 Screen_message_frequency 10 Output_time_plotfile 0.4 Output_frequency_plotfile -1 Output_frequency_restart -1
|
1Read the restart file written after the final sedimentation stage, i.e. "hm_005_Case1_stage_11.rst".
2The time on the Time_curve_data is modified so that the displacement occurs between 44 and 46 Ma (0.08 strain/2 Ma = 0.04/Ma strain rate).
3Define the control data to perform 1000 flow steps over the stage duration of 2.0Ma and 200 mechanical steps per flow step, i.e.: a)Target_number_time_steps set to 200 defines the target number of mechanical steps per flow step. b)Initial_time_increment set to 0.002 defines the flow step time increment, i.e. 1000 flow steps over 2.0 Ma duration. |
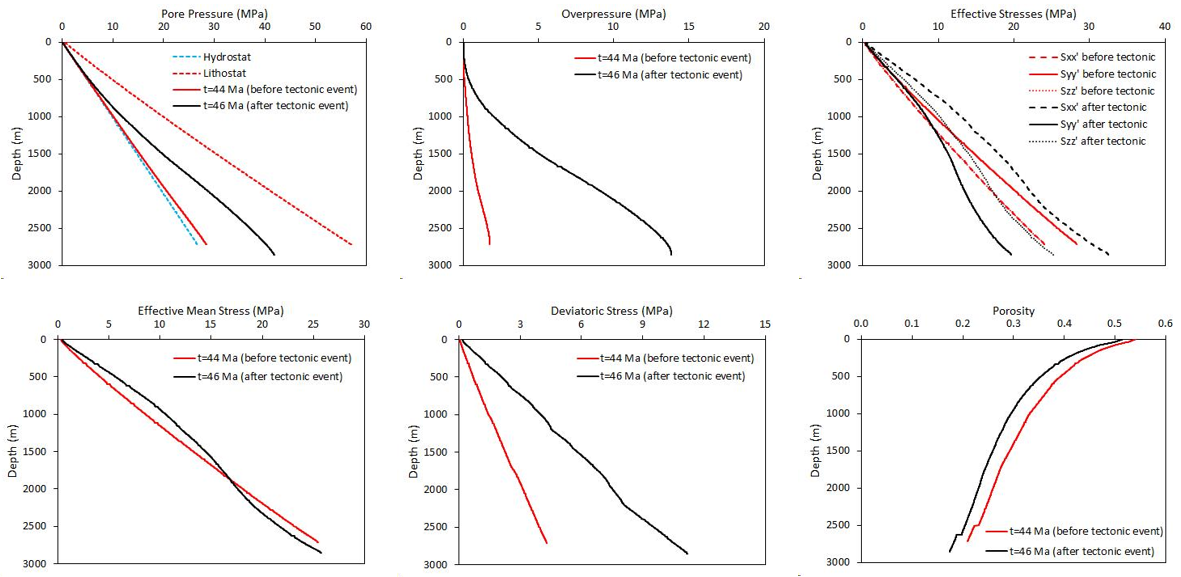
The result files for the project are in directory: HM_005\Exercises\Case 2\Results. This directory also contains the excel file 00_hm_005_Case02.xlsx which contains ParaView plot over line results at time 44 Ma and 46 Ma as shown graphically below.
The effects of the tectonic event can be visualized below: - increase in overpressure, - decrease in porosity, - increase in Sxx' and Szz', decrease in Syy', - increase in deviatoric stress and effective mean stress. - As expected, the maximum overpressure at the base is lower at 10.6MPa for this Case2 with the reduced tectonic strain rate (0.04/Ma) than in Case1 (18.9MPa for strain rate of 0.16/Ma).
Parameters vs depth before and after the tectonic event
|

