Overview of SR4 Model
This section provides an overview of the SR4 constitutive model for weakly cement rock. This is a single surface rate-independent non-associated elastoplastic model based on extensions to classical critical state theory.
| Introduction |
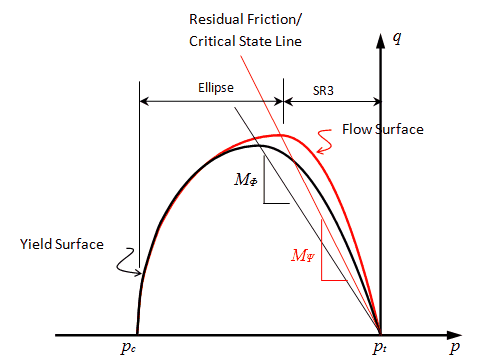
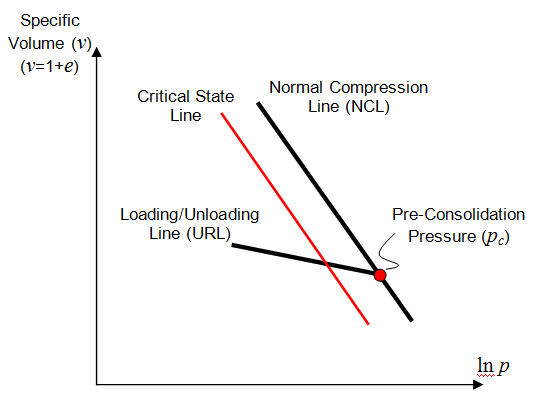
The state boundary surface for the SR4 model is described as a smooth three-invariant surface composed of two functions that intersect in a continuous manner at the point of maximum deviatoric stress. The shear side is defined using the SR3 surface (Crook et al., 2006) and the compression side is defined by an ellipse; i.e. in a similar manner as the standard Cam Clay model (Wood, 1990) (Figure 6.1). The flow potential surface is the same form as the state boundary surface but is defined with two different parameters. This enables the residual friction (critical state) line to be defined to intersect the state boundary surface on the shear side, as opposed to the peak stress, which is consistent with experimental observations for clays. Both surfaces are smooth in the deviatoric plane with the state boundary surface being defined using a deviatoric correction term, whereas the flow potential is circular.
|
| Governing Equations |
Shear Yield and Potential Surfaces The state boundary shear surface intersects the hydrostatic axis in tension and is defined as:
The deviatoric stress q is defined as:
The potential shear surface is defined as:
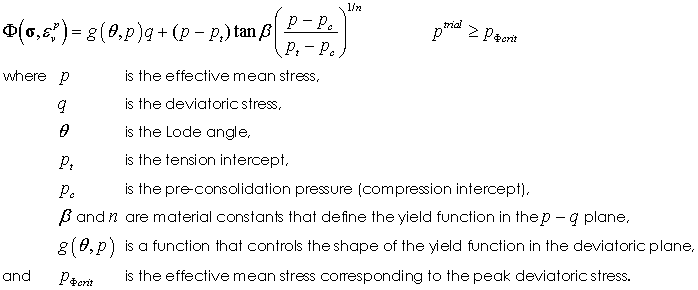
Cap Yield and Potential Surfaces The yield surface for the cap is defined as:
The flow potential cap is defined in a similar manner as:
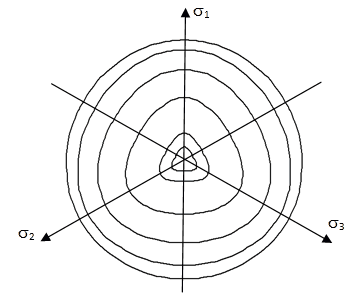
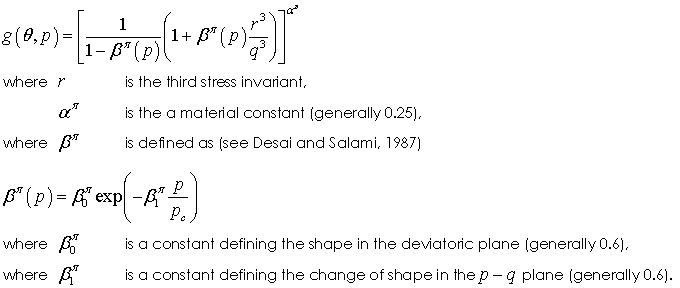
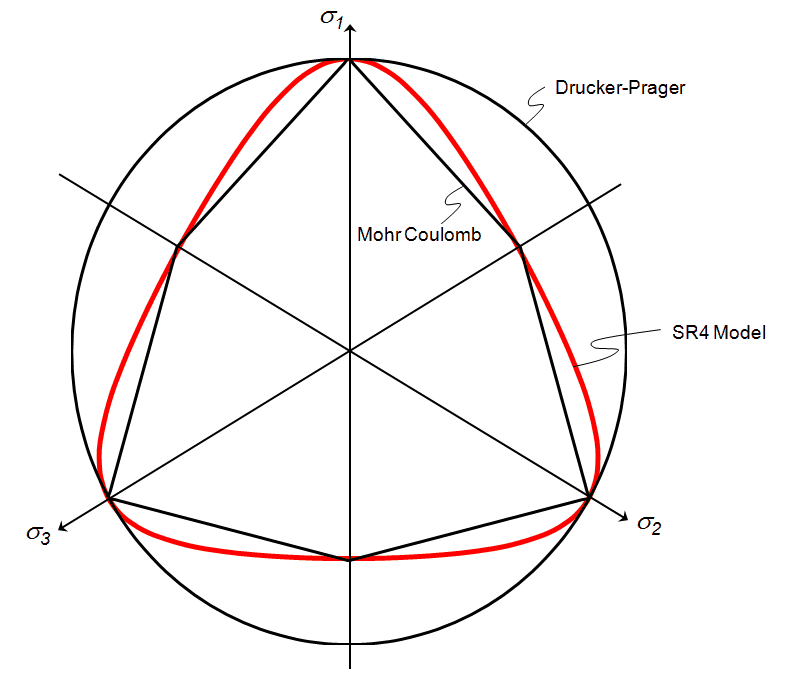
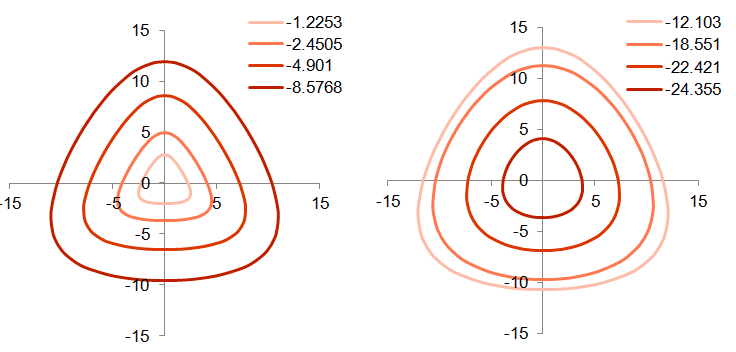
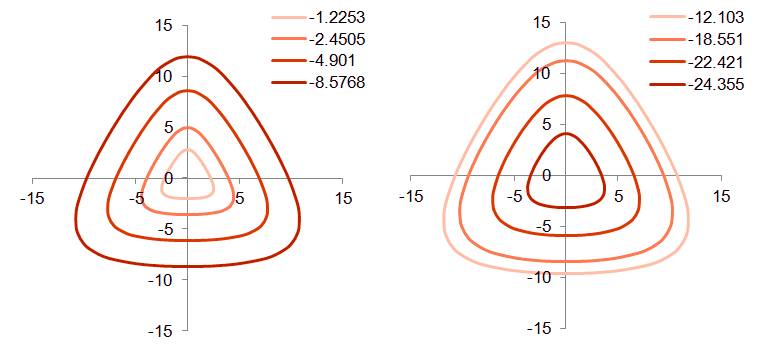
Yield Surface Shape in Deviatoric Plane Comparison of the response in confined triaxial compression (CTC) and reduced triaxial tension tests (RTE) shows that the yield surface is larger in compression than in tension; i.e. when plotted in the deviatoric plane the yield surface is non-circular. End cases conditions for the shape of the yield surface in the deviatoric case are Mohr-Coulomb (yield surface independent of the intermediate stress) and the circular Drucker-Prager Surface (see van Eekelen (1980) for review). A general smooth surface is used in the SR4 model where g(θ,p) is defined as:
g(θ,p) is scaled so that the strength in triaxial compression directly corresponds to strength calibrated using compressive triaxial (CTC) tests and the strength is reduced in reduced triaxial extension (RTE) tests; i.e.
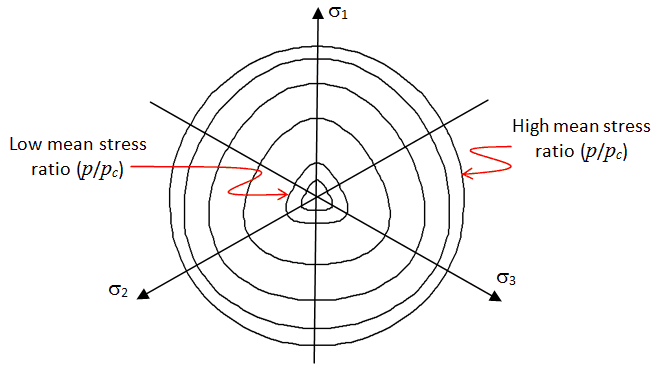
The dependence of βπ on the effective mean stress enables the observed transition from the rounded-triangular yield surface at low mean stress to a circular yield surface at high mean stress. Different values of απ have been proposed and απ = 0.25, (β0)π = 0.6 and (β1)π =1.0 has been shown to provide a good fit for sands.
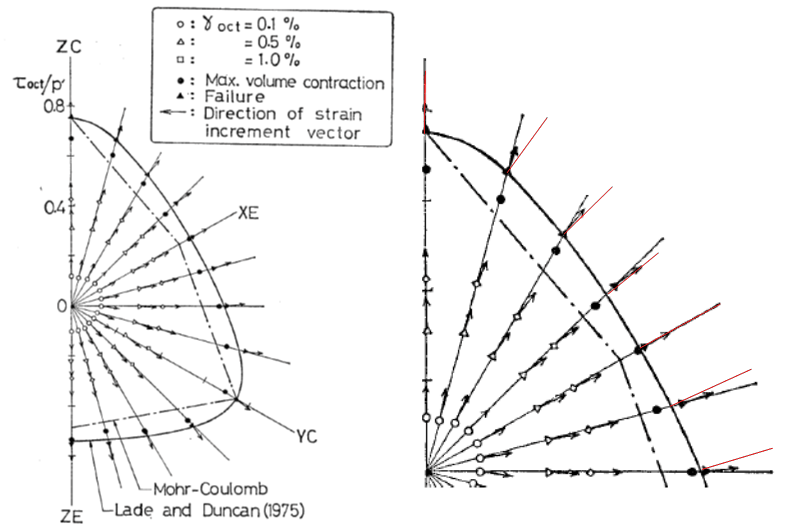
Yield Surface in Deviatoric Plane Potential Surface Shape in Deviatoric Plane The potential surface is circular in the deviatoric plane. This choice is made on the basis if experimental evidence obtained from true triaxial tests on sands (Yamada and Ishihara, 1979). It is evident, by comparison that the flow increments with the local yield surface normal directions, that the flow direction is closer to a radial flow assumption in the deviatoric plane rather than the normality condition flow normal to the yield surface).
Measured strains in the Deviatoric Plane (Yamada and Ishihara, 1979)
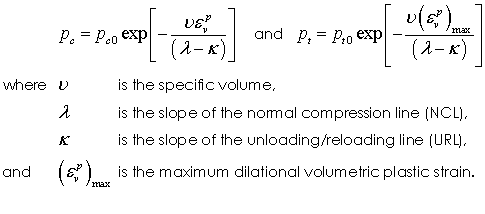
Hardening/Softening Law The evolution of the yield function is governed by the void ratio or plastic volumetric strain; i.e.
This general expression includes the specific form for Cam Clay type models i.e.
Fracture Energy Regularisation Material softening often leads the propagation of localisations, representing shear bands or faults. While the onset of localisation may be readily predicted, accurate representation of the propagation of localizations and evaluation of the energy dissipation in the post-localization configuration is, more difficult using standard continuum approaches. This is due to a number of well-documented issues including:
1. The direction of propagation may be severely biased by the direction of the grid lines; e.g. localizations aligned with the element edges or element diagonals. 2. Energy dissipation by both mode-I or mode-II deformation on the localisation bands is very sensitive to the fineness of the discretisation; i.e. the solutions are dependent on the element length scale rather than a physical material length scale. 3. Large shear movement on the localisations causes excessive mesh distortion which results in termination of the solution unless the domain is remeshed.
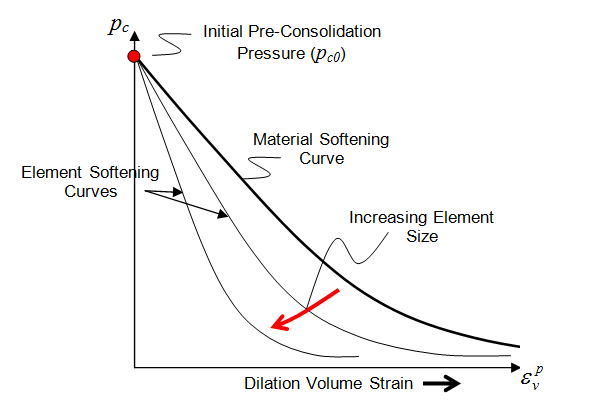
ParaGeo uses the fracture energy approach, where the global energy dissipation is regularized by including fracture energy (Gf) as a material constant in the equations governing state variable evolution (Bažant and Oh, 1983). This fracture energy approach arises from linear elastic fracture mechanics (LEFM) and has been adopted by numerous researchers for mode-I fracturing of quasi-brittle materials. Generally, the strain-softening constitutive response includes additional material constants associated with the crack band width and the localization is deemed to occur in the finite volume of the crack band, which ensures finite energy dissipation. Whilst the standard fracture energy approach has been shown to work well for mode-I fracturing of rock and concrete, the characteristic response of some rock types shows significant departure from the assumptions of LEFM. This may be approximately described by assuming that the energy release rate for fracture growth is variable and is defined by a nonlinear resistance curve (Bažant et al., 1993) instead of the constant Gf. Adoption of this concept leads to a simple frictional regularization model (Crook et al., 2003, Pietruszczak and Mróz,1981) of the form
This expression states that as the element size increases the softening slope becomes steeper. This is consistent with the requirement that the energy dissipated should be approximately independent of the element size; i.e. if larger elements are used, giving larger volumes associated with the failure zone, the strain associated with the deformation must decrease to maintain the same energy dissipation as obtained with a the finer mesh.
The fracture energy approach has the advantages that: (a) Mesh invariance of the global energy dissipation is approximately maintained within an acceptable range of element size. (b) The approach may be implemented to regularize both mode-I and mode-II localization. (c) It is straightforward to implement within any finite strain framework and for a range of constitutive models.
It must be recognized, however, that although the energy dissipation is mesh size independent the localization limiter is strictly only valid for the Sub-h and Iso-h models; i.e. in models where the localisation is equal or less than the characteristic length of the finite elements. Furthermore, in Sub-h simulations the localization is limited to a single band of elements, so that the sharp gradients in the strain field will be poorly approximated if the strain field is evaluated using the standard element interpolation functions. Notwithstanding these limitations, the effectiveness of the regularization methodology in correctly reproducing size effects in mode-II localisation has been demonstrated by simulation of thick-walled cylinder (TWC) tests for Berea sandstone and Castlegate sandstone, where the sample internal radii ranged from 8mm to 200mm (Crook et al., 2003).
|
| Overview of Material Parameters |
The material parameters may be grouped as Yield Surface in p-q Plane •Pre-consolidation pressure (pc) - which defines the onset of compressive yield in hydrostatic compression and can be measured using a hydrostatic compression (HTC) test •Tension intercept (pt) - which is generally defined via fitting the yield surface to uniaxial compression (UCS) and low confinement CTC tests •Friction parameter (β) and exponent (n) - which define the shape of the yield surface in the p-q plane and are established using CTC tests.
Flow Potential in p-q Plane •Friction parameter (ψ) and exponent (m) - which define the shape of the flow potential surface in the p-q plane and the slope of the critical state line. Ideally the slope of the critical state line would be established from the residual strength measured in triaxial tests. For cemented rock, however, triaxial tests are rarely performed to sufficient strain to fully establish critical state conditions. Consequently some judgement based on the mineralogy of the rock often has to be used to ensure that a physically realistic critical state slope (residual friction angle) is represented by the characterisation.
Deviatoric Plane Parameters Three parameters are used to define the shape of the yield surface in the deviatoric plane απ , (β0)π and (β1)π . These parameters can be estimated using reduced triaxial tension (RTE) and true triaxial compression experiments; i.e. where the sample is subjected to three different orthogonal stresses. True triaxial tests are not routinely performed and generally and experimental testing plane may only include one or two RTE tests. Consequently, the deviatoric plane parameters are usually set approximately and a suggested set of values is απ = 0.25, (β0)π = 0.6 and (β1)π = 1.0 Notes 1Although the deviatoric plane correction term is generally, not all values of απ are valid. It is strongly suggested that characterisations always use απ = 0.25. 2The parameter (β0)π has a theoretical maximum limit above which the yield surface is no longer convex. The parameter should be defined in the range 0 < (β0)π 0 < 0.7. The shape of the yield surface becomes more round as is β0π -> 0, with β0π = 0 corresponding to a circular surface. 3The parameter (β1)π defines how the shape of the yield surface changes as a function of the effective mean stress ratio (p/pc). This is desirable as while the shear strength of rock has very different strength in CTC and RTE tests, this becomes less evident when the sample is deformed the compaction regime. When (β1)π = 0,0 yield surface is independent of effective mean stress. As the value of (β1)π is increased, the dependence on (p/pc). increases, giving more circular yield surfaces at lower values of (p/pc).
Hardening/Softening Data The hardening curve for pc and pt is specified as a piecewise linear function of volumetric plastic strain. This data can be generated using ParaGeoMDB by specifying •The hardening modulus (λ); i.e. slope of the normal consolidation line (NCL) in the v vs ln p plot. •The range of the curve fit; i.e. εvp(min) and εvp(max), where εvp(min) and εvp(max) are the most compressive and most dilational volumetric plastic strain expected in the simulation •Residual values for pre-consolidation pressure (pc(resid)) and tensile strength (pt(resid)), where by default pc(resid = pc0/100 and pt(resid = pt0/100 and pc0 and pt0 are the initial pre-consolidation pressure and tensile intercept. The residual values prevent the yield surface from shrinking to zero size if large dilational volume strain occurs.
Hardening/Softening Data for the SR4 Model
Regularisation Parameters Three regularization parameters are specified •The characteristic length scale (lc) for the material •The exponent (n) - generally in the range 0.6 < n < 1.0. •The maximum allowable change (fallow), where fallow must be greater than 1. Generally fallow=100 meaning that the scaling factor for the volumetric strain defining the hardening data may be between 1 and 100. Notes 1The value of lc is dependent on the scale of the simulation. For cases where the characteristic deformation-scale of the simulation is of the same order as the deformation-scale of the experimental test; e.g. well bore stability analysis, the characteristic length corresponds to the width of a single shear band (e.g. 2-3mm). 2In large-scale simulations, where the deformation-scale is many orders of magnitude greater than the experimental scale, the effects of up-scaling; i.e. the apparent difference in physical properties of large rock samples relative to small-rock samples, and mesh regularisation need to be considered as two distinct but related phenomena. In this case the characteristic length for mesh regularisation is not the length associated with a single fracture, but the length associated with the fault zone. This provides a characteristic length that is the same order as the element discretisation.
|
References
Bažant, Z. P. & Oh, B. 1983. Crack band theory for fracture of concrete. RILEM, Materials and Structures, 16, 155-177. Bažant, Z. P., Lin, F. & Lippmann, H. 1993. Fracture energy release and size effect in borehole breakout. Int. J. for Num. and Anal. Meth. Geomech., 17, 1-14. Crook, T., Willson, S., Yu, J. G. & Owen, R. 2003. Computational Modelling of the Localized Deformation Associated with Borehole Breakout in Quasi-Brittle Materials. J. Petr. Soc. Eng., 38, 177-186. Crook, A. J. L., Willson, S. M., Yu, J. G. & Owen, D. R. J. 2006. Predictive modelling of structure evolution in sandbox experiments. Journal of Structural Geology, 28, 729-744. Pietruszczak, S. & Mróz, Z. 1981. Finite element analysis of deformation of strain softening materials. Int. J. Num. Meth. Eng., 17, 327–334. Van Eekelen, H. a. M. 1980. Isotropic yield surfaces in three dimensions for use in soil mechanics. Int. J. Num. Anal. Meth. Geomech., 4, 89-101. Wood, D. M. 1990. Soil Behaviour and Critical State Soil Mechanics, Cambridge University Press. Yamada, Y. & Ishihara, K. (1979). Anisotropic deformation characteristics of sand under three dimensional stress conditions. Soils and Foundations, 19, 79-94.
|

