Case01 Power law model
The data files for the present tutorial case are in ParaGeo_Tutorial_Examples/Mat_004/Case01/Data and the spreadsheets with the results in ParaGeo_Tutorial_Examples/Mat_004/Case01/Results
In this tutorial case the behaviour of the power law creep model will be discussed. As shown in the overview section the rate of creep is described by the following equation:

Before considering creep a rate independent material characterisation will be defined. Then creep will be introduced to illustrate its effects. To that end a series of simulations consisting of a hydrostatic compression test (hct) loaded to 50 MPa in 20 hours are performed. The results of the simulations are compared to an hct experiment by Flatebø (2005) later back-analysed by Crook et al. (2008). It should be noted that back analysis of such experiment accounting for the rate dependent behaviour is not attempted here as insufficient data is available. However the experimental results are used for reference in both rate independent and rate dependent (including creep) material characterisations to assuming an arbitrary chosen experimental time frame and loading rate for the test. The experiment assumes a loading rate of 2.5 MPa/h, load to 50 MPa in 20 hours.
The key data for the rate independent (no creep considered) material characterisation is described below. Note that at the bottom of the present page a table encompassing all the simulated cases with the chosen material parameters is provided for reference.
Data File |
|
* Material_data NUM=1 ! --------------------------------- Name "Chalk_water_rind" ! ------------------------------------------------------------- Grain_stiffness 70000.0 ! MPa Grain_density 2700.0 ! ------------------------------------------------------------- Porosity_model_type 1 Porosity 0.4 ! ------------------------------------------------------------- Elastic_model_type 1 Elastic_properties IDM=2 /Young's Modulus (E)/ 900.0 ! MPa /Poisson's Ratio (v)/ 0.3 ! ------------------------------------------------------------- Plastic_material_type 1 ! SR3 Plastic_properties IDM=8 /Tensile intercept/ 1.0 ! MPa /Pre-consolidation pressure/ -10.0 ! MPa /Friction parameter/ 60.5 ! Deg /Dilation parameter/ 55.0 ! Deg /Beta0 (deviatoric plane)/ 0.50 /Beta1 (deviatoric plane)/ 0.60 /Alpha (deviatoric plane)/ 0.25 /Exponent n/ 2.0 ! ------------------------------------------------------------- Hardening_type 3 Hardening_properties IDM=4 JDM=1 /kappa/ 000 /Lambda/ 0.2 /pc res/ -0.01 /pt res/ 0.001 ! ------------------------------------------------------------- Regularisation_type 1 Regularisation_properties IDM=4 /Characteristic Length (l(c))/ 0.07 ! m /Constant (A)/ 0.0 /Exponent (n)/ 0.60 /Max. Change Factor/ 100.0 ! ------------------------------------------------------------- Permeability_type 1 Permeability 1E-18 ! ------------------------------------------------------------- Biot_type 1 Biot_constant 1.0 ! ------------------------------------------------------------- Fluid_saturation 1.0 Singlephase_fluid_name "Water" ! -------------------------------------------------------------
|
1.For this material characterisation constant elasticity is assumed for the sake of simplicity (no poroelastic effects will be captured).
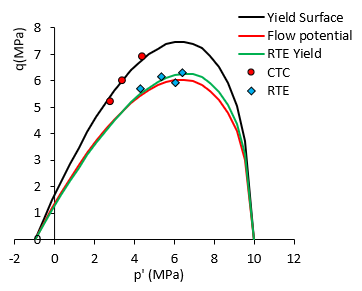
2.The SR3 plasticity model is used to ensure compatibility with a creep law to be added in further cases. Note that the parameters were chosen to fit yield data points presented in Crook et al. (2008) as shown in the picture below. Again, the data is only used as a reference. Additional data including experimental setup conditions and experimental post yielding behaviour would be required to perform a calibration representative of the target material.
Fit of the yield surface in compression and extension to CTC and RTE experimental data
3.Analytical hardening is used to define the plastic compressibility and hardening behaviour of the material.
4.Note that both, Young's modulus and the hardening parameter lambda (λ) were calibrated to give a reasonable fit to the elastic and plastic compression behaviour observed in Flatebø (2005) hct experiment. This will be shown below.
|
As can be seen in the figure below a reasonable fit is obtained for the rate independent material characterisation. A key difference is that whereas the experiment shows a progressive transition from elastic to plastic behaviour around 10 MPa of hydrostatic load, the simulation shows a sudden transition. This is because the adopted constitutive model considers elastic or plastic conditions depending whether the stress path is inside the yield surface or on the yield surface respectively. A more sophisticated plasticity model considering multiple plastic stages would be required to capture such gradual transition from elasticity to plasticity (e.g. a model with more than one yield surface and multiple compressibility parameters).
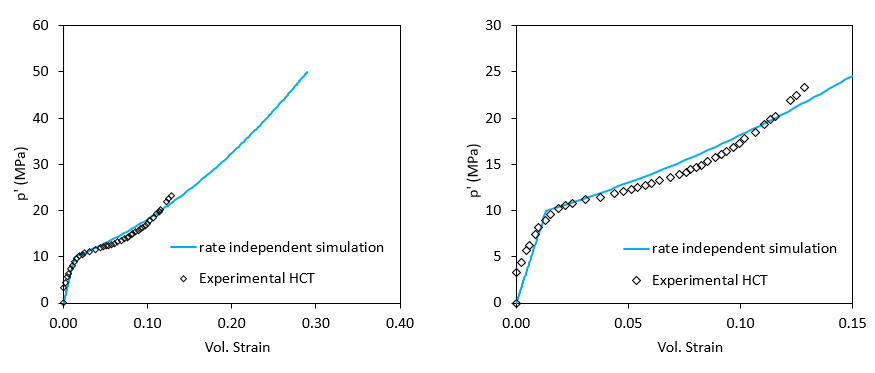
Comparison of experimental and simulated hct tests for the rate independent material characterisation. The left picture shows the complete range of strain and stress values in the simulation. The right picture is from the same simulation and experimental data with the axis showing the range relevant to the experimental results.
The creep law data corresponding to Case01a is discussed below. It should be noted that the rest of the data is identical to the rate independent material characterisation.
Data File |
|
* Material_data NUM=1 ! --------------------------------- Name "Chalk_water_rdep01" ! ------------------------------------------------------ (...) ! ------------------------------------------------------ Rate_dependent_type 1 Rate_dependent_properties IDM=2 /Gamma/ 1E-3 /Exponent/ 3.0 ! ------------------------------------------------------ (...)
|
1.Creep model data is added to the previous material characterisation in order to consider creep behaviour
2.Rate_dependent_type is set to 1 in order to use the simple power law model
3.The two properties to be input for the power law model are defined within the keyword Rate_dependent_properties. Those are: i.γc = 1E-3 ii.nc = 3
|
In the figure below in can be seen that the addition of the creep law results in a curve that plots well above the experimental data and the rate independent simulated case (Case00) underestimating the volumetric strain for a given hydrostatic stress load (red curve, Case01a). This is because we are taking into account loading rate effects and for the considered loading rate in our simulations, the plastic strains have not had enough time to fully develop. Consequently the actual yield surface is smaller than the apparent yield surface, over which the stress state lies on. Hence if the target is to obtain a better fit with the data considering creep (and assuming that the chosen creep material parameters are appropriate) the reference pre-consolidation pressure must be decreased. A reasonable good fit is obtained by decreasing the reference pre-consolidation pressure to 4.5 MPa while keeping the rest of the data unchanged (see green curve for case01g in the figures below). For such pc value and the loading rate considered in the simulation the assumed creep material parameters lead to a certain amount of creep strain already developed in the loading time frame and a certain amount of "locked" creep strain that would develop if additional time is enabled. This implies that if different creep material parameters were assumed (leading to different creep rate) a different value of reference pc may be required to obtain a good fit with the data. Hence in order to be able to properly characterise a material accounting for creep, experimental data performed at different loading rates would be required. Note that in the figures below the results for a rate independent material characterisation with the new reference pc value of 4.5 MPa is plotted for reference (see the grey dotted curve for case00b).

Comparison of results for different simulated cases and the experimental data from Flatebø (2005). The left plot shows the full range of stresses and strains obtained from the simulations whereas the right plot shows the range relevant to the experimental data.
In the figure below it can be seen the effect of varying the loading rate for the same material parameters. As can be observed, the faster the loading rate, the lower the volumetric strain for a given load because of the less time allowed for the creep strain to develop. If a simulation would have been performed at a sufficient slow loading rate the resulting stress strain curve would be identical to the rate independent model results. Note that the curvature towards higher volumetric strain values as the simulation approaches the 50 MPa load is due to the S-curve function adopted in the Time_curve_data used to define the loading rate in the simulation.
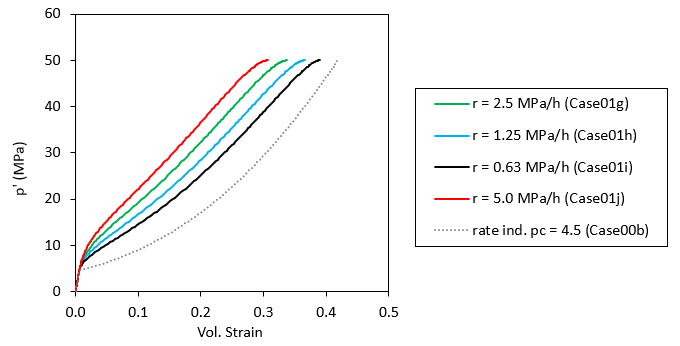
Comparison of different hct simulations performed at different loading rates for the same material parameters
In the figures below the effect of varying the two creep material parameters γc and nc is illustrated. The results show that:
1.The higher the nc value the closer the resulting curve will be from the rate independent solution (high values of nc increase the creep rate)
2.The higher the γc value the closer the resulting curve will be from the rate independent solution (high values of γc increase the creep rate)
This is consistent with the equation describing the creep law shown at the beginning of the current tutorial page, which reformulating it in terms of creep strain rate yields to:
![]()
From which is evident to derive that the strain rate ![]() is positively correlated with both γc and nc .
is positively correlated with both γc and nc .
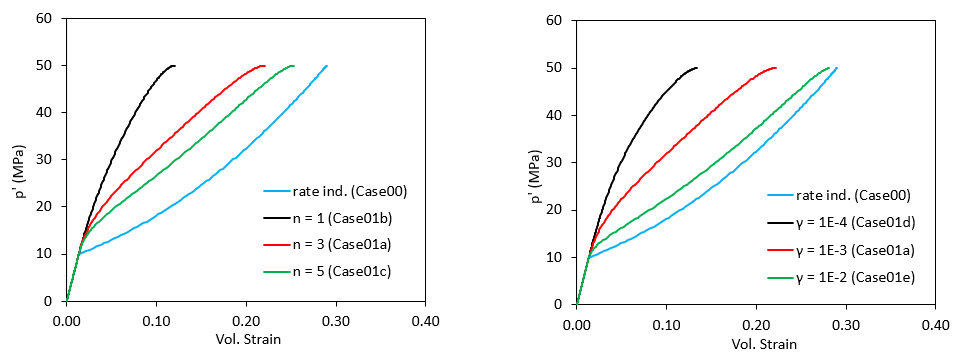
Comparison of different simulation cases with different values of nc (left) and γc (right). Note that all the cases shown here were run with a reference pc of 10 MPa
To properly observe the creep behaviour described by the creep law a hct simulation comprising several stages/periods of loading and load holding is simulated (Case01k). The conditions considered for such case are shown in the table below.
|
Load increment (MPa) |
Duration (h) |
Load rate (MPa/h) |
Loading stage 1 |
10 |
4 |
2.5 |
Holding stage 1 |
0 |
120 |
0 |
Loading stage 2 |
20 |
4 |
5 |
Holding stage 2 |
0 |
120 |
0 |
Loading stage 3 |
20 |
16 |
1.25 |
Holding stage 3 |
0 |
120 |
0 |
Definition of the conditions for the different loading and holding stages simulated in Case01k
The picture on the left from the figure below shows that during loading phases the strain-stress path drifts from the rate independent solution finishing each loading phase at a lower volumetric strain relative to the rate independent solution. Then during the load holding phases (load is kept constant during 120 hours) creep strain develops leading to and increase in volumetric strain with the stress-strain curve returning to the rate independent solution. Another typical way to display the same results in geotechnical engineering is shown in the figure in the centre where void ratio is plotted as a function of the effective mean stress p' in a log scale. As void ratio is a direct function of the initial void ratio and volumetric strain the same exact behaviour is observed.
In the figure on the right the evolution of the applied load (p') and the resulting evolution for void ratio (e) is shown. As can be observed at the end of each loading phase the void ratio has an initial rapid decrease with the compaction rate decreasing asymptotically. This occurs as the actual yield surface increases with the ongoing plastic creep strain, leading to a decrease in Γ and hence a decrease in the creep strain rate.

Results for Case01k considering multiple stages of hydrostatic loading and load hold periods compared with the rate independent solution. In the right hand side plot the vertical dotted lines indicate the beginning and end of each loading phase and points "a" and "b" indicate the points selected for plotting the evolution of the tress path and the yield surface in the next figure.
In the figure below initial and final stress states during the loading and holding period occurring between "a" and "b" points highlighted in the previous figure (right figure) as well as key yield surfaces are shown. As can be seen at the end of the loading period the stress state (red diamond) lies outside of the actual yield surface (dotted line) and on an apparent yield surface (green curve). Then during the holding period the load is kept constant so the stress state remains on (p', q) = (30, 0) point while plastic creep strain develops and the actual yield surface increases in size until the stress state lies on it (thick black line).
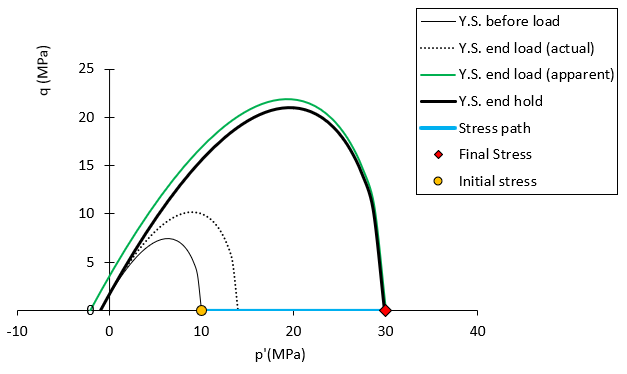
Stress path, stress states and yield surfaces at the beginning and end of loading phase and end of holding phase (period occurring between points "a" and "b" in the previous figure)
In the figures below the same loading conditions as described above for case01k are used to illustrate the effect of different creep material parameters. As can be observed the creep strain rate (void ratio decrease rate) is positively correlated with both γc and nc as was previously discussed.
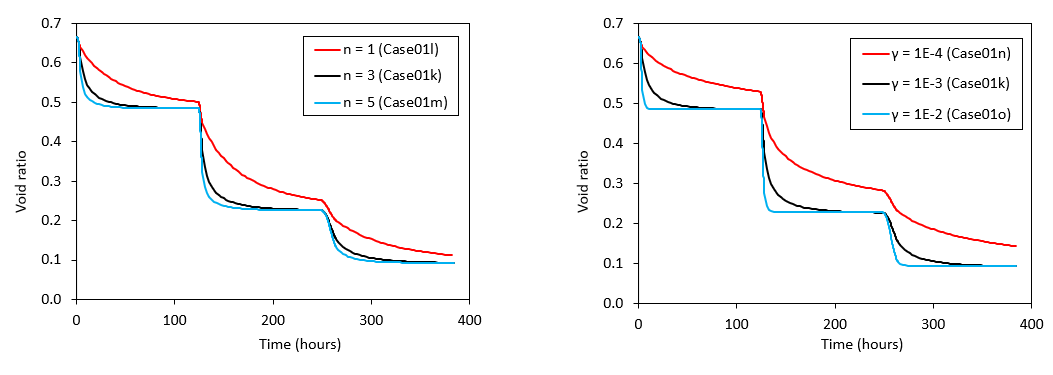
Comparison of void ratio evolution for hct simulations considering the same loading and holding stages as case01k but with different values of nc (left) and γc (right)
The table below compiling all the cases simulated and discussed in the present tutorial case is provided for reference purposes.
Case name |
Type |
ref. pc (MPa) |
γc |
nc |
Max. Load (MPa) |
Duration (h) |
Load rate (MPa/h) |
Case00 |
hct |
10 |
-- |
-- |
50 |
20 |
2.5 |
Case00b |
hct |
4.5 |
-- |
-- |
50 |
20 |
2.5 |
Case01a |
hct |
10 |
1.0E-3 |
3 |
50 |
20 |
2.5 |
Case01b |
hct |
10 |
1.0E-3 |
1 |
50 |
20 |
2.5 |
Case01c |
hct |
10 |
1.0E-3 |
5 |
50 |
20 |
2.5 |
Case01d |
hct |
10 |
1.0E-4 |
3 |
50 |
20 |
2.5 |
Case01e |
hct |
10 |
1.0E-2 |
3 |
50 |
20 |
2.5 |
Case01g |
hct |
4.5 |
1.0E-3 |
3 |
50 |
20 |
2.5 |
Case01h |
hct |
4.5 |
1.0E-3 |
3 |
50 |
40 |
1.25 |
Case01i |
hct |
4.5 |
1.0E-3 |
3 |
50 |
80 |
0.63 |
Case01j |
hct |
4.5 |
1.0E-3 |
3 |
50 |
10 |
5.00 |
Case01k |
hct (multi stage) |
4.5 |
1.0E-3 |
3 |
50 |
384 |
variable |
Case01l |
hct (multi stage) |
4.5 |
1.0E-3 |
1 |
50 |
384 |
variable |
Case01m |
hct (multi stage) |
4.5 |
1.0E-3 |
5 |
50 |
384 |
variable |
Case01n |
hct (multi stage) |
4.5 |
1.0E-4 |
3 |
50 |
384 |
variable |
Case01o |
hct (multi stage) |
4.5 |
1.0E-2 |
3 |
50 |
384 |
variable |
Table summarising model parameters and conditions for all the cases discussed in the present tutorial case
| References |
Crook, A. J. L., Yu, J. G., Flatebø, R. E. and Kristiansen T. G. (2008) Computational modelling of the rate dependent deformation and liquefaction of chalk. Paper presented at the The 42nd U.S. Rock Mechanics Symposium (USRMS), San Francisco, California, June 2008
Flatebø, R. E. (2005). Stability and flow of Chalk near production wells. PhD Thesis, Stavanger
|

