Case 2 Variable Sedimentation Rate
The sedimentation rate can be varied by changing the time curve defining its motion, thereby changing its position when each layer is deposited. In the following case the deposition rate is increased from the constant rate of 200m/Ma to 300m/Ma for the first 4 Ma and then reduced to 133m/Ma for the remainder of the simulation.
Data File |
|
* Sedimentation_horizon NUM=1 ! --------------------------------- Name "General" Facet_topology IDM=2 JDM=1 1 2 Coordinates IDM=2 JDM=2 0.0 200.0 60.0 200.0 Time_curve 1000 Displacement IDM=2 0.0 1.0
* Load_curve_data NUM=1000 ! --------------------------------- Time_curve IDM=3 0.0 4.0 10.0 Load_factor IDM=3 0.0 1200.0 2000.0
|
1.The reference displacement for vertical movement of the sedimentation horizon is set at 1.0. This simplifies specification of the load factor 2.The load curve has three points to define a variable sedimentation rate 3.Between 0.0 and 4.0 Ma 1200m is sedimented (sedimentation rate = 300m/Ma) 4.Between 4.0 Ma and 10 Ma 800m is sedimented (sedimentation rate = 133m/Ma |
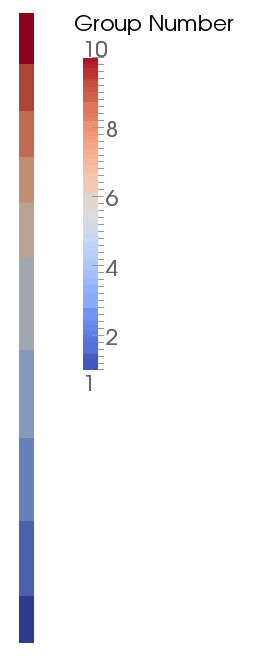
The result files for the project are in directory: mech_002\exercises\Case 2\results. Contour plots of porosity, horizontal stress (Stress-XX) and vertical stress (Stress-YY) are shown together with the layer geometry identified by the group number. The increased thickness of the layers sedimented in the first 4.0 Ma is evident from the layer geometry. The distribution of porosity and stress in the final configuration is almost identical to Case 1 as the material response is time independent and other rate dependent mechanisms; e.g. porous flow are not being considered. The peak stress is slightly higher as, due to the change in sedimentation rate, the Case 2 column is larger than in Case 1.
|
|
|
|
Layer Geometry |
Porosity |
Vertical Stress (MPa) |
Horizontal Stress (MPa) |
Contour Plots in the Final Configuration
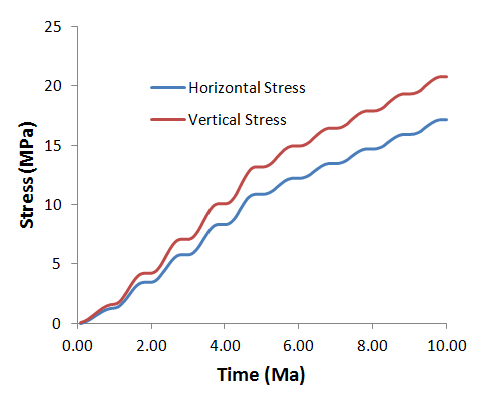
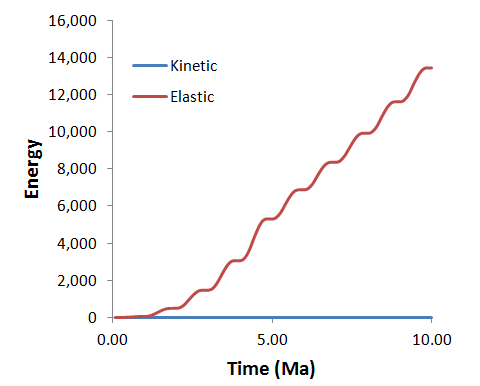
The increased sedimentation rate in the first 4.0 Ma is also evident in the point and global history plots of stress and energy. As in Case 1 the curves show that a quasi-static state is achieved at the end of each depositional step. These graphs can be created by pasting the history data from ParaGeo into Excel sheet "mech_002/Case2 History".


Stress and Energy as a Function of Time


