Extract Block
The Extract Block filter allows selection of which data blocks (e.g. element groups, contact surfaces, etc) we want to visualize and which should be hidden. This is useful for example to visualize only selected formations. Note that if any variable scale range is rescaled to data range (by clicking the ![]() icon in the task bar) in an Extract Block filter this will only consider the active block data. To perform an Extract Block filter:
icon in the task bar) in an Extract Block filter this will only consider the active block data. To perform an Extract Block filter:
1. Select the dataset to be manipulated in the Pipeline Browser.
2.Click in Filters/Alphabetical/Extract Block
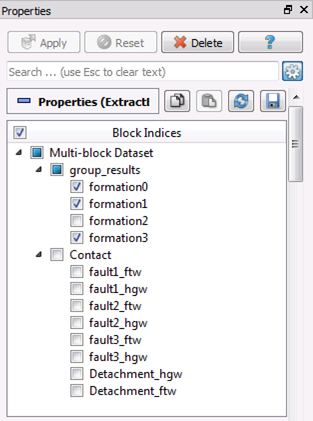
3.On the Extrack Block properties menu (below the Pipeline Browser); Select the data blocks that will be visible. In the example bellow the filter is used to deactivate all contact data and formation 2 group data so that only group data for formations 0, 1 and 3 is plotted.
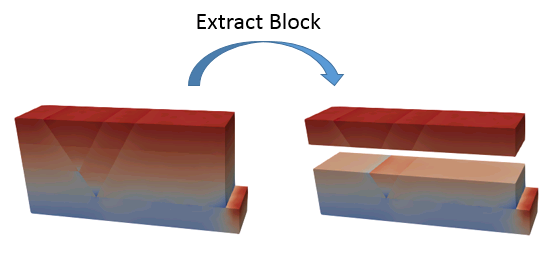
4. Click on the ![]() button. Now in the display window only extracted block from the original dataset are shown (see for example the picture below).
button. Now in the display window only extracted block from the original dataset are shown (see for example the picture below).

Extract Block filter properties menu

Data before (left) and after (right) Extract Block filter
