Glyph
The Glyph filter allows display of vectors for any vectorial variable (e.g. displacement, velocity, flow velocity, stress tensor, etc) at some or all nodes of the domain. To apply the Glyph filter:
1.Select the dataset containing vector data we wish to plot in the Pipeline Browser.
2.Click on the ![]() icon on the task bar or on Filters/Alphabetical/Glyph.
icon on the task bar or on Filters/Alphabetical/Glyph.
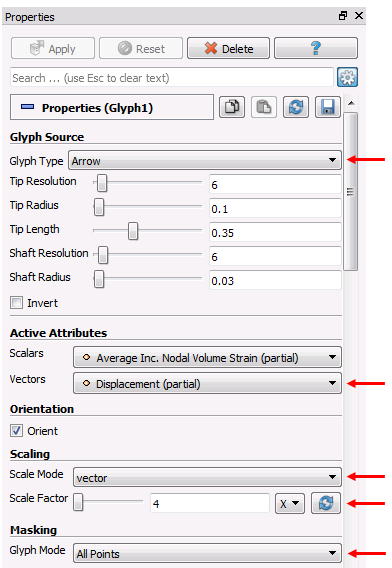
3.In the Properties menu leave Glyph Type set to "Arrow". There are other types of glyphs that may be used (e.g. lines, sphere, etc.)
4. In Vectors select the vector data we wish to plot (in the figure below we use displacement)
5.In Scale Mode select vector. This will ensure that Glyph vectors are dimensioned according to the vectorial data magnitude multiplied by a scale factor.
6.Write an scale factor. The size of the Glyph arrows will be scaled according that value.
7.In Glyph mode select "All Points". This will ensure that glyph vectors are plotted at every node. There are other options available (such as plot a vector every N points).
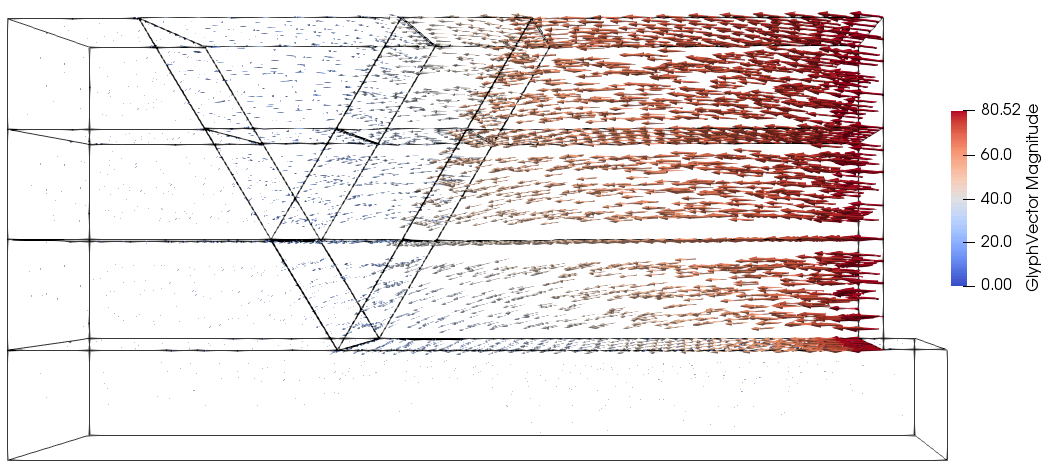
8.Click on ![]() . Now displacement vectors displayed (in this example with their size scaled by a factor of 4).
. Now displacement vectors displayed (in this example with their size scaled by a factor of 4).
9.The Glyph arrows may be coloured according to the Glyph vector magnitude by selecting ![]() in the variable selection drop down menu. Alternatively they may be coloured according to any available variable.
in the variable selection drop down menu. Alternatively they may be coloured according to any available variable.

Glyph filter properties menu. The relevant options are pointed by red arrows.

Geometry with displacement Glyph vectors
