Plot Over Line
The Plot Over Line filter displays graphs of variables on a user defined line intersecting the model domain. It is similar to extract a straight well. To create a Plot Over Line :
1.Select the dataset in the Pipeline Browser
2.Click in the ![]() icon from the task bar or Filters/Alphabetical/Plot Over Line. An initial line crossing the model from opposite corners will appear in the display window.
icon from the task bar or Filters/Alphabetical/Plot Over Line. An initial line crossing the model from opposite corners will appear in the display window.
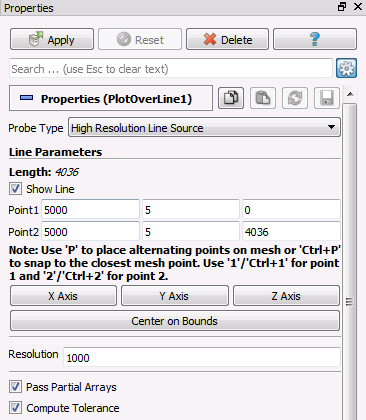
3.Define the position of the line by either, draggin the line edge points in the display window with the mouse or defining their coordinates in the properties menu.
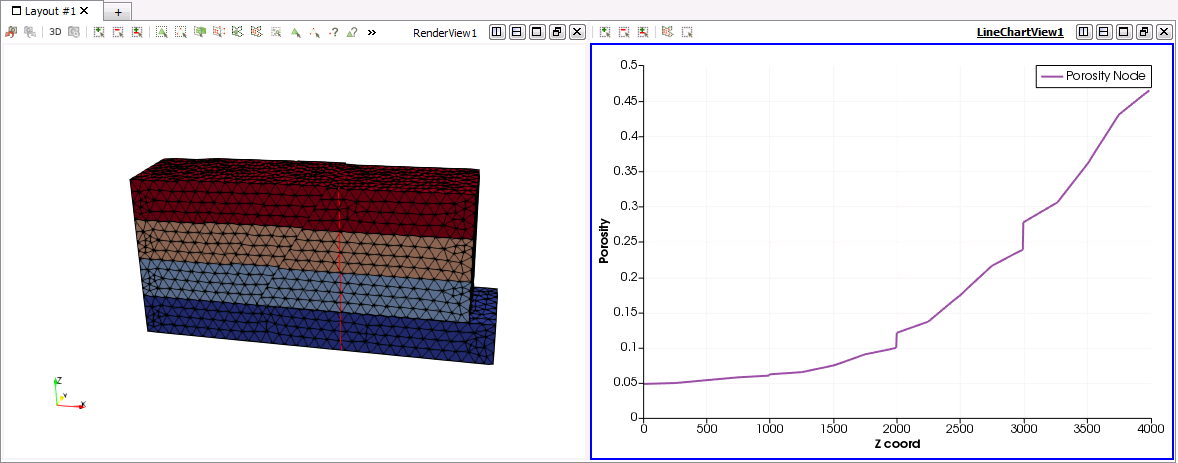
4.Click on ![]() . The display window will be split and a graph line will be shown in the new display window.
. The display window will be split and a graph line will be shown in the new display window.
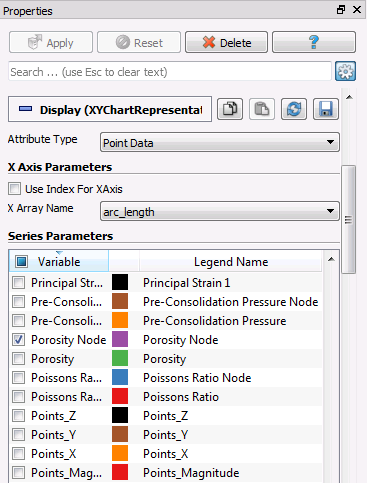
5.In the properties menu select/unselect the variables to be plotted.
6.The data for all variables (selected and unselected) may be exported into a .CSV file. To do this select the Plot Over Line dataset in the Pipeline Browser and click on either File/Save Data... or click on the ![]() icon from the task bar.
icon from the task bar.
Important Note: To export the data in .CSV format ParaView version 5.4.1 (recommended) or older must be used. In more recent versions the exported data format is incorrect with missing values.

Plot Over Line properties menu

Plot Over Line properties menu: Selection of plotted variables

Display Window after application of plot over line filter
