ParaView Screen Overview
ParaView Initial Set Up
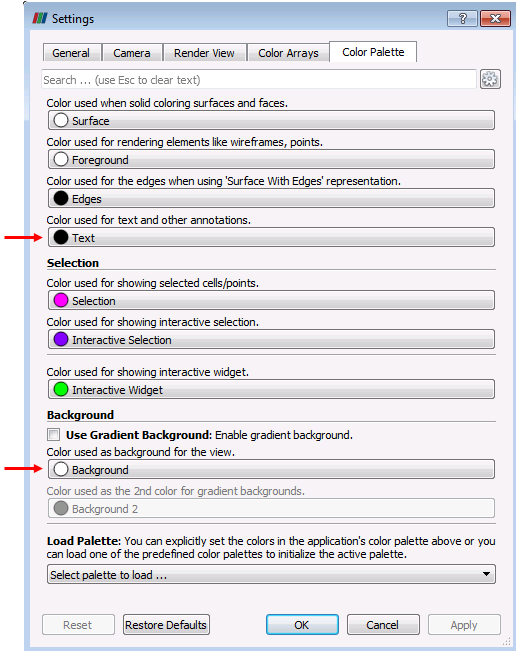
By default, the ParaView's background colour is grey with white text for legend labels and titles. It is recommended to change this so that the background is white and the text is black. This facilitates an optimum look of copy & pasted figures into a text document. This is achieved via Edit/Settings/Color Palette and change the corresponding options (highlighted below by the red arrows).

Setting Window
ParaView Initial Screen Overview
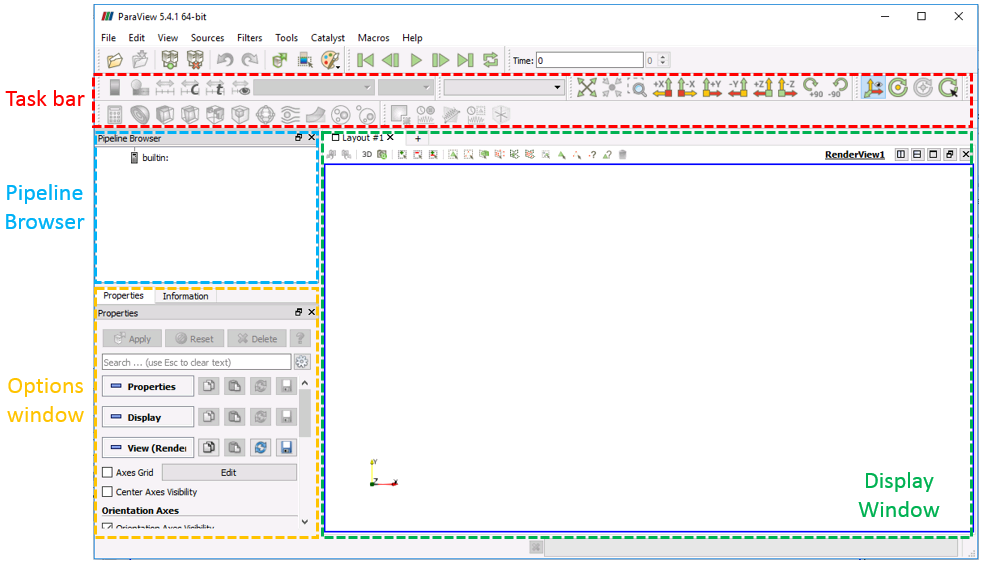
The most important features of the initial ParaView screen are described and shown in the picture below.
In the Task Bar is a quick access to filters, define the range of the contour plots, quick access to camera operations, etc.
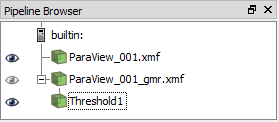
In the Pipeline Browser all the datasets loaded will be shown with the most recent one located at the bottom of the pipeline. Note that the most recent datasets have visibility priority over the older ones so that they will be displayed on top. We can turn the visibility ON/OFF for each data set by clicking on the adjacent ![]() icon (see the Pipeline Browser picture below).
icon (see the Pipeline Browser picture below).
Note that any dataset can be renamed by selecting it and then do an additional mouse click above its name, which allows you to type a new name.

Pipeline Browser
The Options Window contains options related to the loaded plot data set/filter applied to the plot data set. The options will vary according to the nature of the type of data (i.e. a block contour data will display different options than a Threshold filter for example).
In the Display Window we can visualize the loaded plot data.
The time and animation buttons are found above the task bar and are shown here. These allow forward/backward stepping in time or playing an animation.
![]()
Time and animation buttons

Main parts of the initial ParaView window
