Useful Tools
Selection tools and selection display inspector
Selection tools in ParaView for selection of individual or multiple elements or nodes are located above the display window. The most commonly used options are:
•![]() Add to selection: leave it ON to add a new selection to a previous active selection
Add to selection: leave it ON to add a new selection to a previous active selection
•![]() Subtract from selection: leave it ON to subtract a new selection from a previous active selection
Subtract from selection: leave it ON to subtract a new selection from a previous active selection
•![]() Select Cells On: Select cells by dragging the mouse to define a selection box. Selected cells will be those which are partially or completely within the selection box.
Select Cells On: Select cells by dragging the mouse to define a selection box. Selected cells will be those which are partially or completely within the selection box.
•![]() Select Points On: Select nodes by dragging the mouse to define a selection box. Selected nodes will be those which are partially or completely within the selection box.
Select Points On: Select nodes by dragging the mouse to define a selection box. Selected nodes will be those which are partially or completely within the selection box.
•![]() Interactive Selection of Cells On: Place the cursor above the cell to highlight it. Click to add it to the current selection.
Interactive Selection of Cells On: Place the cursor above the cell to highlight it. Click to add it to the current selection.
•![]() Interactive Selection of Points On: Place the cursor above the node to highlight it. Click to add it to the current selection.
Interactive Selection of Points On: Place the cursor above the node to highlight it. Click to add it to the current selection.
•![]() Clear current selection: Clears current selection.
Clear current selection: Clears current selection.
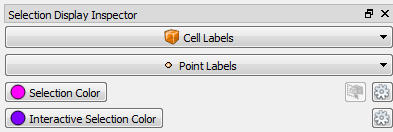
Once a cell or node is selected its data may be displayed using the selection display inspector. To open the selection display inspector menu click on ParaView menu View/Selection Display Inspector. On the Selection Display Inspector menu we may click on Cell Labels and/or Point Labels and select the information to be displayed. See for example the plot below in which porosity at cells (left) and nodes (right) are selected to compare it with the contour plot.

Selection Display Inspector Menu

Example of cell (left) and point (right) selection with porosity information
Insert Text and Geometric Figures
"Sources", in ParaView menu, allows insertion of Text, Boxes, Spheres, Lines, Poly-lines, etc. To do that we have just to
1.select the source to insert,
2.define its properties below the Pipeline Browser, and then
3.click on the Apply button.
For example, text is inserted by:
1.Click on Sources/Text
2.Type in the text to be inserted in the text box below the Pipeline Browser (e.g. "Example Text")
3.Click on Apply button. The text will show on top left corner of the Render View screen.
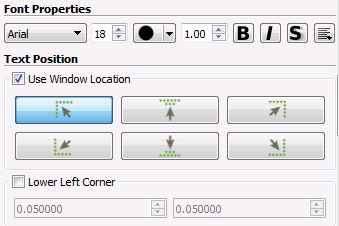
4.The font properties and text position can be changed on the properties window, located below the text box where we have written the inserted text.
5.If "Use Window Location" is left selected (see picture below) any of the six buttons can be used to position the text on the screen (top left corner, top center, top right corner, bottom left corner, bottom center and bottom right corner respectively).
6.If "Lower Left Corner" is selected, the text position is defined by either; (a) typing in the lower left corner coordinates of the text or; (b) by dragging the text with the mouse on the Render View screen.

Inserted Text Font Properties
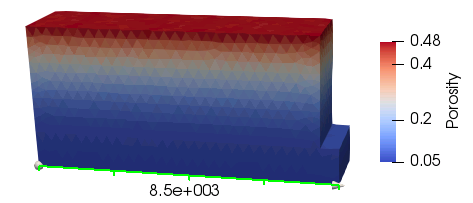
The ruler source is very useful as it facilitates measurement of distances on a plot. This is achieved by:
1.Click on Sources/Ruler. The ruler properties menu will appear below the Pipeline Browser and the two ruler points will appear on the Render View screen close to the origin point (0, 0, 0).
2.Either; type in the two point coordinates in the properties menu, or drag the ruler points on the Render View to the desired location.
3.Click on Apply button. The ruler will show up on the Render View window.

Example of ruler usage
