Case02 Herschel-Bulkley
Case 02 is based on the Herschel-Bulkley visco-plastic isothermal Model 1 and the temperature-dependent Model 2 with properties defined in the table below. Note that in this example, the initial viscosity parameter for Model 2 is calibrated to be equivalent to Model 1 at 'reference' temperature of 20°C with all other material properties the same for both models. In other words, the results for the isothermal case should match the temperature-dependent case at 20°C.
Note that Herschel-Bulkley is sometimes referenced here as HB and the Herschel-Bulkley temperature-dependent model 2 as the HBT model.
|
||||||||||||||||||||||||
Herschel-Bulkley Material Properties |
||||||||||||||||||||||||
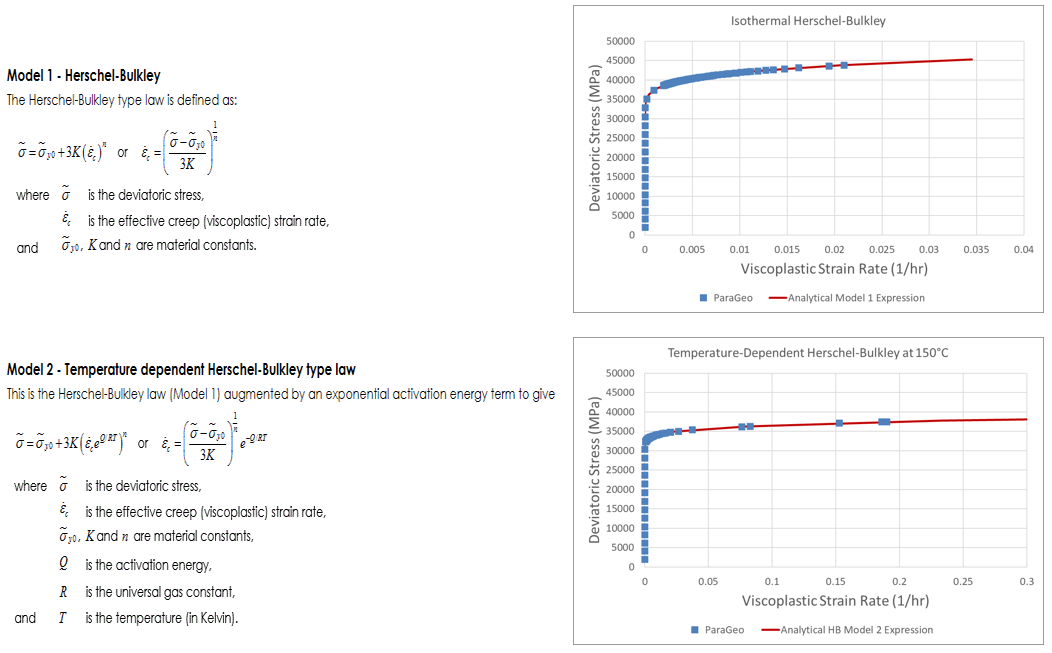
Viscosity and strain rate as a function of deviatoric stresses for the Herschel-Bulkley isothermal (Model 1) and temperature-dependent (Model 2) at various temperatures are shown in the following plots.

Viscosity and Strain rate as a function of Deviatoric Stress for HB Isothermal (Model 1) and HB Temperature-Dependent (Model 2) at various temperatures
Simulations are performed for the HB isothermal model, and the HBT model at 20°C and 150°C for the following element types:
•Explicit - HEX8 element (with hourglass control).
•Implicit - HEX8_Bbar element and HEX8M mixed formulation element.
Following are descriptions of some key data and the element types investigated for the implicit and explicit analyses. Note that the simulations are performed over 5.0 time units whereby the vertical displacements in Z are compressed linearly to -3mm (20% strain) over 1.0 time unit and then held at this displacement for 4.0 time units to t=5.0. This is in order to observe the results during the loading and relaxation phases.
Material_data
Material_data defines the material properties of the Herschel-Bulkley model. The temperature-dependent model 2 properties are shown here.
|
Group_data
Group_data sets the group name, element type, material name, porous flow type and the associated volume entity.
|
Results
The following figure show the compression of the billet as the applied displacement in Z increases from 0 to -3mm (20% strain) over 1.0 time unit and is then held at this displacement for 4.0 time units to t=5.0.
Billet compression as the applied displacement increases
The ParaGeo results plot for deviatoric stress over viscoplastic strain rate over the duration of the simulation is shown to be in line with the analytical expression for the Herschel-Bulkley isothermal model 1 and the Herschel-Bulkley temperature-dependent model 2 at 150°C.
ParaGeo results plot of deviatoric stress over viscoplastic strain rate overlaid with analytical expression for HB model 1 and HBT model 2 at 150°C
The following graphical plots (sampled at a point on the outer boundary of the billet half-way up) show the development of deviatoric stress and viscoplastic strain rate during the loading phase (t=0 to 1.0) and relaxation phase (t=1.0 to 5.0) for the Herschel-Bulkley isothermal model. Comparisons are made between the explicit and implicit results for the three element types investigated.
Development of deviatoric stress and viscoplastic strain rate for various element types for HB isothermal model
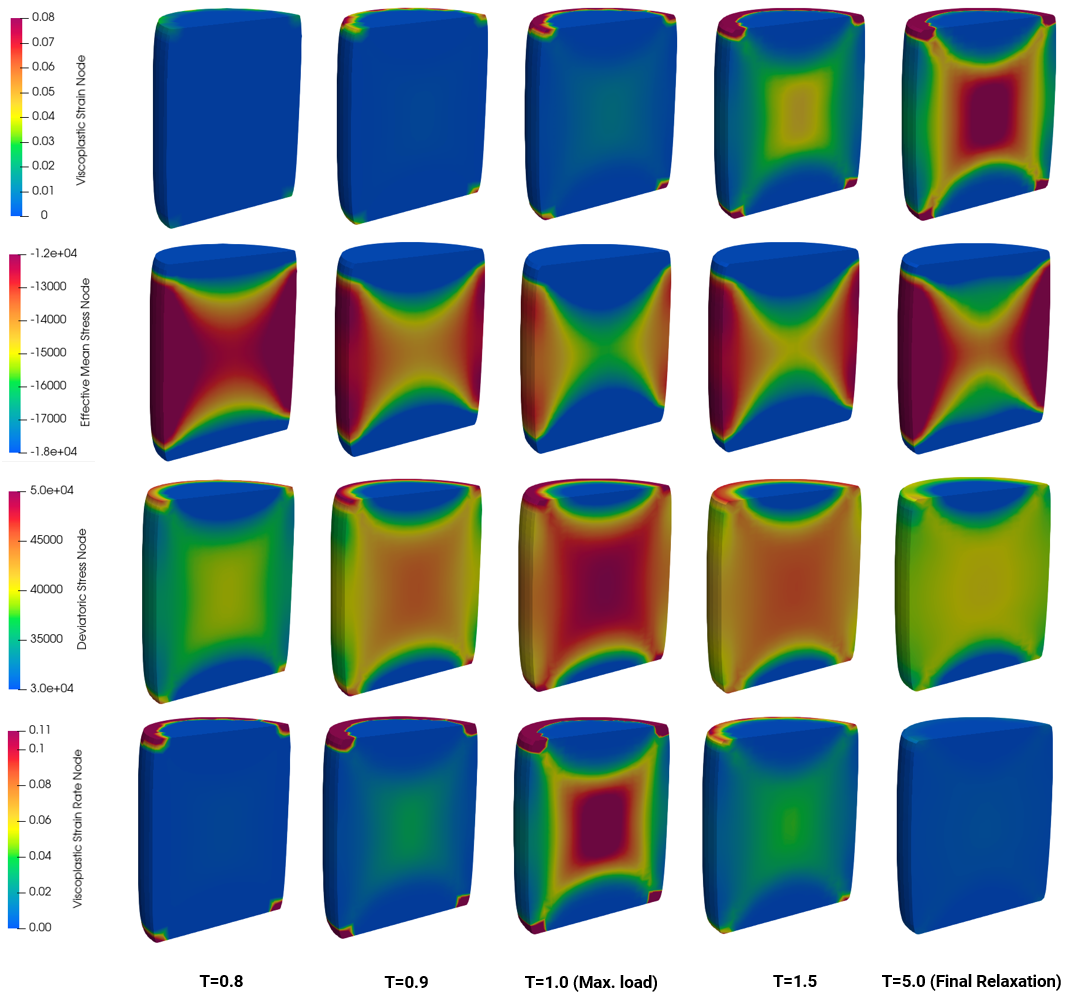
The evolution of the viscoplastic strain, effective mean stress, deviatoric stress and the viscoplastic strain rate are shown in the figures below for the HEX8M Herschel-Bulkley isothermal case. Values are observed to be most intense at the billet centre with localisation across the centre.
HB Isothermal HEX8M model: Development of viscoplastic strain, effective mean stress, deviatoric stress and viscoplastic strain rate (clipped view)
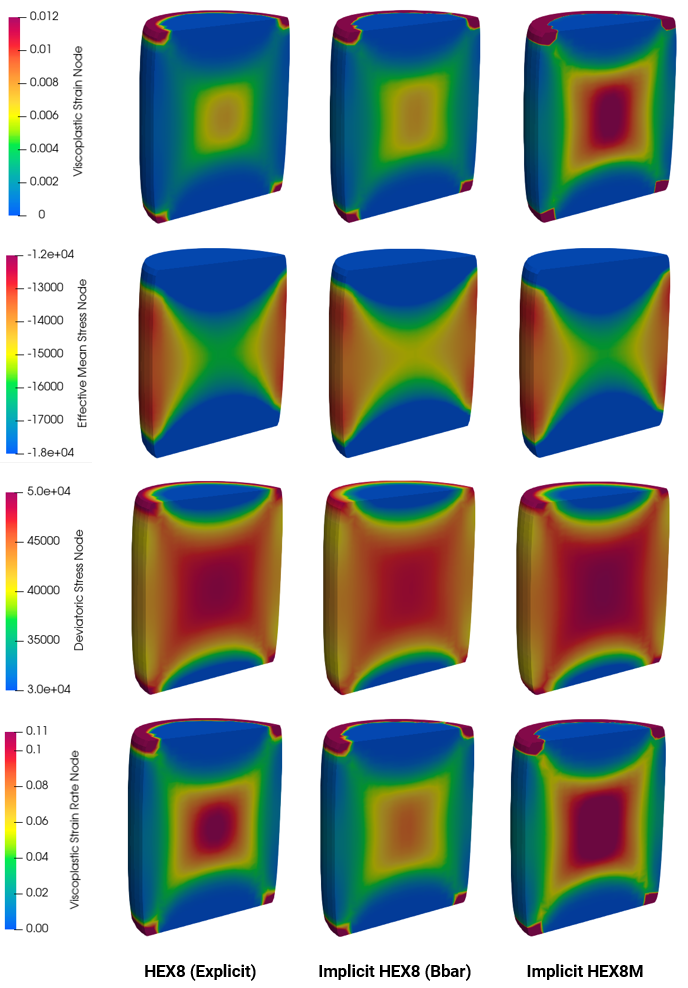
The figures below present a comparison of various parameters at maximum load T=1.0 for the different element types which show the mixed element formulation to be more elevated compared against the standard elements.
HB Isothermal: Comparison of various parameters at max. loading (T=1.0) for different element types in clipped view
Note that as expected (due to calibration of the input viscosity K value in the material data), the results of the Herschel-Bulkley isothermal and temperature-dependent model results at 20°C are identical and therefore not presented here. The following graphical plots (sampled at a point on the outer boundary of the billet half-way up) show the development of deviatoric stress and viscoplastic strain rate during the loading phase (t=0 to 1.0) and relaxation phase (t=1.0 to 5.0) for the Herschel-Bulkley temperature dependent model at 150°C. Comparisons are made between the explicit and implicit results for the three element types investigated.
Development of deviatoric stress and viscoplastic strain rate for various element types for HBT model 2 at 150°C
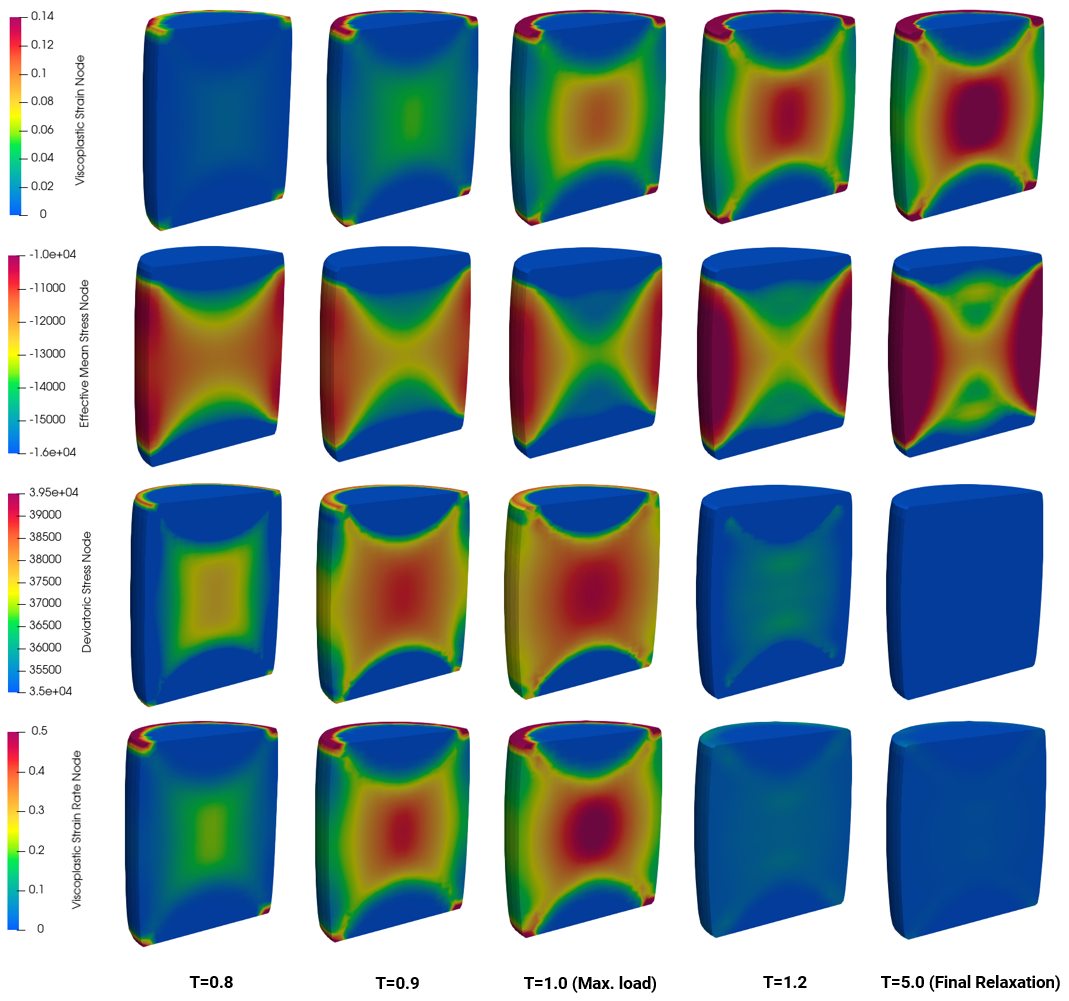
The evolution of the viscoplastic strain, effective mean stress, deviatoric stress and the viscoplastic strain rate are shown in the figures below for the HEX8M Herschel-Bulkley temperature dependent model at 150°C case. Values are observed to be most intense at the billet centre with localisation across the centre.
HBT at 150°C HEX8M model: Development of viscoplastic strain, effective mean stress, deviatoric stress and viscoplastic strain rate (clipped view)
The figures below present a comparison of various parameters at maximum load T=1.0 for the different element types which show the mixed element formulation to be more elevated compared against the standard elements. However it should be noted that the simulation time for the mixed element formulation is more expensive (for this example c.a. 3 times) than the standard element.
HBT at 150°C: Comparison of various parameters at max. loading (T=1.0) for different element types in clipped view
|


