Case03 U-Shaped Geothermal Well with Multiple Well Completions
The primary goal of this thermal example is to demonstrate the usage and wellbore heat transmission of U-shaped geothermal wells with multiple well completions in a multi-layered rock model.
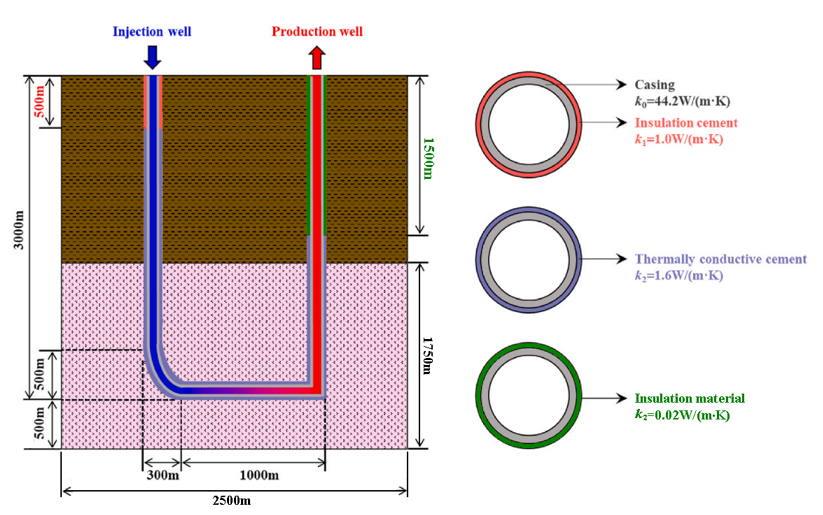
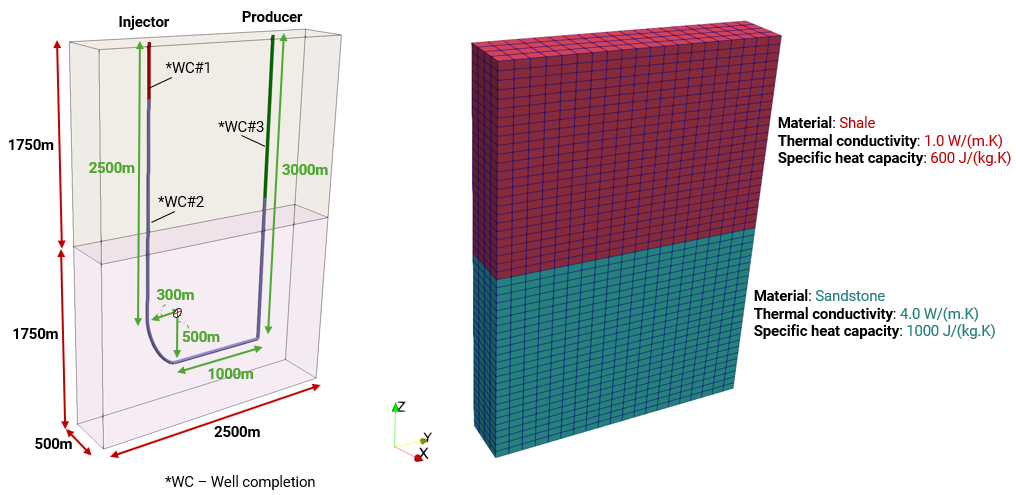
The simulation example comprises a U-shaped injector and producer closed-loop well system (L1300m X H3000m) in a two-layered rock domain with dimensions L2500m X W500m X H3500m as shown below. The well design features a smooth curvature connecting the vertical injection section to the horizontal section, facilitating efficient fluid flow. The transition from the horizontal section to the vertical production section exhibits a sharper bend, potentially enhancing heat transfer performance through induced turbulence. While this abrupt bend might result in a higher pressure drop, the trade-off could be acceptable if the increased turbulence significantly boosts heat extraction from an economic standpoint. However, the focus in this example does not consider the balance between the thermal efficiency and operation costs, but the nature of temperature distribution and heat transfer behaviours across the different geological formations.
The well completion is made up of an inner casing and three different outer insulation materials with different thermal properties. Similarly, the two rock layers also have different thermal material properties. The rock is discretised using 4,000 hexahedral elements and the well elements using 285 points with element size of 25m. The rock formation is prescribed temperatures of 25°C at the top and 156.25°C at the base of the model, i.e. geothermal gradient of 0.0375°C/m. Fluid at 15°C is injected into the well of radius 0.07971m at a rate of 0.01m3/s (equivalent to 10kg/s). The radial heat transfer between the well and surrounding rock will be simulated in ParaGeo over a 20 year time period using the Hasan model, noting that this model is applicable only to "casing" or "shut" well status, i.e. no leak-off.
Note that the model time unit in this example is defined in "seconds", thus the thermal units and thermal input data can be defined as W/m/K for the conductivity and J/kg/K for the specific heat capacity. If other model time units are used, the thermal input data must be manually scaled to the model time units defined for the example (refer Ex_007 Case01). ParaGeo does not automatically scale the thermal units to the model time units.
The simulation is performed in two stages:
Stage 1: Initialize temperature in the rock with surface temperature of 25 °C and base temperature of 156.25 °C, i.e. thermal gradient of 0.0375 °C/m.
oThe initial rock temperature must be established prior to activation of the well elements since the well elements will adopt the surrounding rock temperature as its initial temperature.
Stage 2: Define well element data and perform heat transfer between rock and injected well fluid over 20 years (i.e. 6.3072E8 seconds) of injection and production.
|
Schematic of U-shaped Well Geothermal Production System (adapted from Ref.1)
|
|
Model and Mesh Definition |
The files for the project are in directory: ParaGeo Examples\General Examples\Ex_008\Case03. Only the key data associated with the usage of well elements and thermal control data will be described here.
Key data for well (Stage 2)
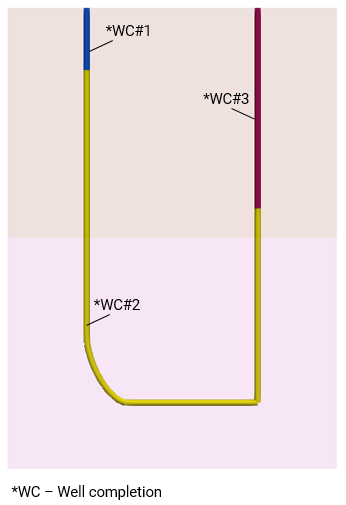
•Well data is defined by two data structures, Well_definition and Well_completion.
Well_definition and Well_completion data
|
Thermal control data
Two thermal control data are required: one for initialising the rock temperature distribution and the other for performing the heat transfer simulation over a 20 year injection and production duration.
Stage 1 Initialisation
Stage 2 Well activation and heat transfer simulation
|
| Results |
The result files for the project are in directory: ParaGeo Examples\General Examples\Ex_008\Case03\Results.
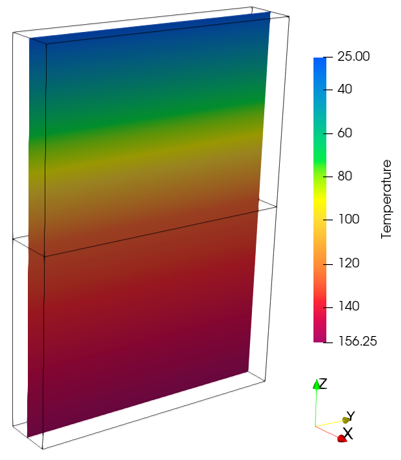
The initial temperature distribution in the rock domain with surface temperature of 25 °C and base temperature of 156.25 °C, as shown in the plot below, serves as the background initial temperature in the well.
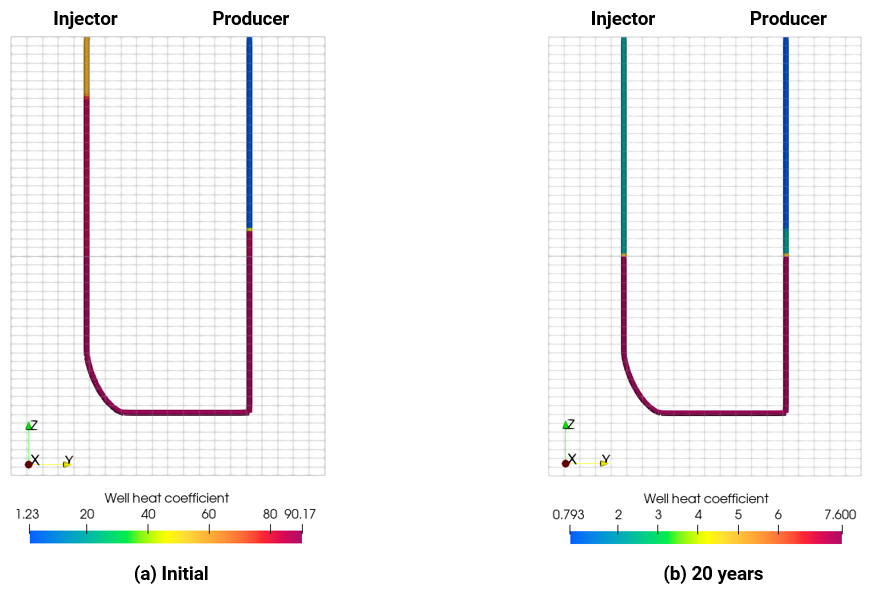
The plot below shows the well heat transfer coefficient computed by ParaGeo for the initial well condition and at the end of 20 years injection and production.
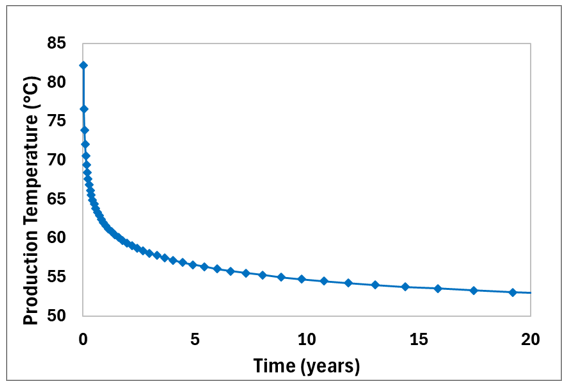
The graphical plot below shows the evolution of production temperature over the 20 years of injection and production. Observed is a very steep production temperature change during the early years of active well life which approaches asymtotic after 20 years.
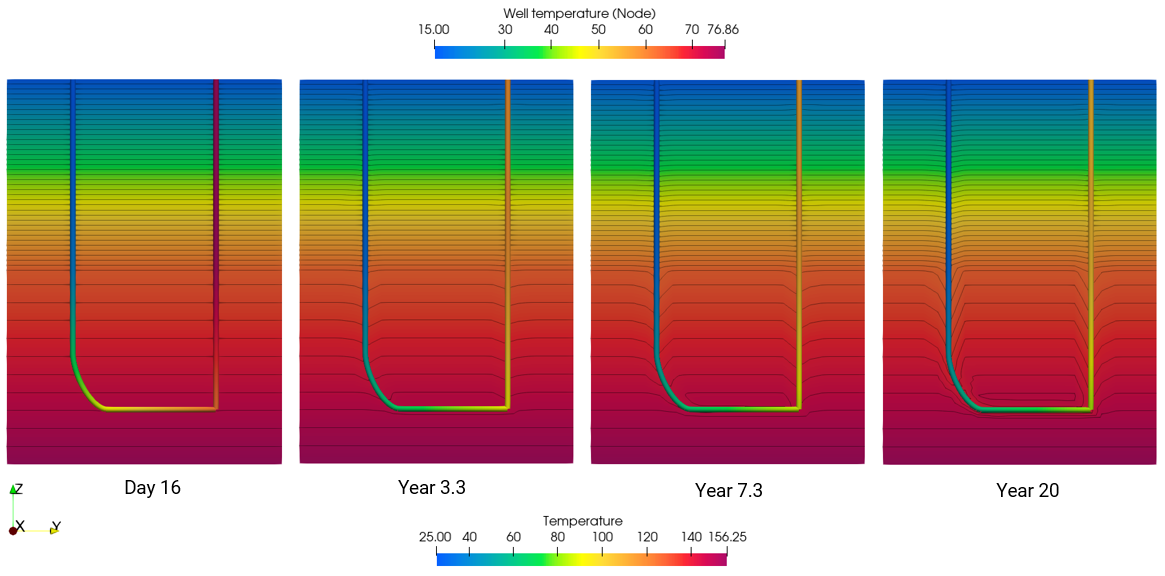
The mid-slice X-X plots below, overlaid with the isosurface temperature contours, show the evolution of temperature distribution in the rock and well over the 20 years of injection/production. The elevated heat transfer coefficient of the deeper well completion #2 enhances its role as a heat sink. This leads to a pronounced temperature gradient, visualised by the downward curvature of the isothermal lines around the wellbore at the base of the formation. In contrast, the producer section (well completion #3), layered with lower thermal conductivity materials displays a less steep gradient. In this region, the wellbore functions as an insulator, minimizing heat transfer to the cooler surrounding rock.
|
References
[1] Yuanyuan Ma, Shibin Li, Ligang Zhang, Songze Liu, Ming Wang, Heat extraction performance evaluation of U-shaped well geothermal production system under different well-layout parameters and engineering schemes, Elsevier Renewable Energy 203 (2023) 473 - 484. [2] Hasan, A.R. and Kabir, S., 2012. Wellbore heat-transfer modeling and applications. Journal of Petroleum Science and Engineering.
|

