Case04 Influence of Skin Factor on Well Elements using the Peaceman Model


Overview

The primary goal of this porous flow example is to demonstrate the application of the Peaceman model on well elements with emphasis on the influence of skin factor.


The standard method has known limitations. When a well is prescribed a flow rate, insufficiently fine background rock elements can cause pore pressure oscillations. Conversely, when a well is prescribed fluid pressure, the entire background element around the open well node adopts the bottomhole pressure, irrespective of element size.


The Peaceman model mitigates these issues by considering the radial distance between well and background nodes, alongside rock permeability and fluid viscosity, thereby effectively accounting for the pressure gradient between the source and the sink.


The skin factor, a crucial parameter in reservoir engineering, measures the impact of near-wellbore conditions on fluid flow. It accounts for formation damage that reduces permeability and increases flow resistance as well as well completion techniques that modify flow resistance and permeability near the wellbore. Furthermore, the skin factor reflects the benefits of stimulation treatments like hydraulic fracturing which enhance flow conditions. It also adjusts for reservoir heterogeneities, ensuring accurate flow rate predictions. In ageing wells, the skin factor helps to model changes in near-wellbore conditions over time, supporting more precise long-term reservoir management.  Note that a positive skin factor represents flow resistance.


Problem Description

The simulation example comprises two separate wells - an injector well and a producer well 250m apart in a rock domain with dimensions L500m X W20m X H100m as shown below. Both wells have a radius of 0.1m.  The rock is discretised using 180x3x90 hexahedral elements and the well elements using 3 points.  The deepest well point is defined as 'open' with the remaining defined as 'casing' (i.e. shut).


The rock is defined with initial hydrostatic pore pressure with 30MPa on the top surface.  The injector well is prescribed an injection flow rate of 432 m3/day (or 5kg/s) and the producer well is prescribed a surface pressure of 20MPa.  Units of the model for stress, length and time are MPa, m and days.


The simulation is performed in two stages:

Stage 1: Initialize pore pressure within the rock domain.

Stage 2: Define well element data and perform flow simulation over 1 day of well injection and production.


To evaluate the impact of the skin factor, three cases are simulated:

Case 04a: Skin factor of 0.5

Case 04b: Skin factor of 5.0

Case 04c: Skin factor of 10.0


Ex_008_Case04_01


Example Model Geometry (overlaid with Mesh Definition)


Ex_008_Case04_02


Injector and Producer Well Loadings


The files for the project are in directory: ParaGeo Examples\General Examples\Ex_008\Case04. Only the key data associated with the usage of well elements and porous flow control data will be described here.


Key data for well (Stage 2)


Well data is defined by two data structures, Well_definition and Well_completion.


Well_definition and Well_completion data

Data File


* Well_definition            NUM=1

! ---------------------------------

 Name                     'InjWell'

 Well_path             IDM=3 JDM=3

   10        125 100

   10        125 75

   10        125 50

 Completion                      1

 Injection_rate                432 ! m^3/day, 5kg/s

 Singlephase_fluid_name     "Water"

 Status_distribution         IDM=3

   "casing"

   "casing"

   "open"

 Radial_flow_model      "Peaceman"

 Flow_skin_factor              0.5

 History_summ_frequency          1


* Well_definition            NUM=2

! ---------------------------------

 Name                    'ProdWell'

 Well_path             IDM=3 JDM=3

   10        375 100

   10        375 75

   10        375 50

 Completion                      1

 Well_type               "Producer"  

 Surface_pressure               20 ! MPa

 Singlephase_fluid_name     "Water"

 Status_distribution         IDM=3

   "casing"

   "casing"

   "open"

 Radial_flow_model      "Peaceman"

 Flow_skin_factor              0.5

 History_summ_frequency          1


* Well_completion           NUM=1

! ---------------------------------

 Radius                    0.1


1Well_definition #1 data structure defines the modelling parameters for the injector well:

a.Well_path defines the coordinates for the 3 points representing the injector well geometry.

b.Completion defines the associated well completion ID number as 1.

c.Injection_rate defines the volume rate of the injected fluid as 432 m3/day.  This is equivalent to 5kg/s.

d.Singlephase_fluid_name specified as "Water" is the name of the fluid defined in the Fluid_properties data structure.

e.Status defines the well status for every point of the well.  Only the deepest point is "open", the remaining are defined as "casing" (i.e. shut).

f.Radial_flow_model defining method to model near-well pore pressure profile is specified as "Peaceman".

g.Flow_skin_factor is defined as 0.5 for Case04a, 5.0 for Case04b and 10.0 for Case04c.

h.History_summ_frequency set to 1 outputs well summary history data at every analysis step.


2Well_definition #2 data structure defines the modelling parameters for the producer well:

a.Well_path defines the coordinates for the 3 points representing the producer well geometry.

b.Completion defines the associated well completion ID number as 1

c.Well_type keyword defines the well type as "Producer".  This keyword is compulsory when Surface_pressure is defined.

d.Surface_pressure at the top of the well is prescribed as 20 MPa.

e.Singlephase_fluid_name specified as "Water" is the name of the fluid defined in the Fluid_properties data structure.

f.Status defines the well status for every point of the well.  Only the deepest point is "open", the remaining are defined as "casing" (i.e. shut).

g.Radial_flow_model defining method to model near-well pore pressure profile is specified as "Peaceman".

h.Flow_skin_factor is defined as 0.5 for Case04a, 5.0 for Case04b and 10.0 for Case04c.

i.History_summ_frequency set to 1 outputs well summary history data at every analysis step.


3A single Well_completion data structure is used to define the radius of both wells as 0.1m.


Porous flow control data


Two porous flow control data are required: one for initialising the rock pore pressure distribution and the other for performing the porous flow simulation over 1 day of injection and production.


Stage 1 Initialisation

Data File


* Porous_control_data         ! Stage 1 Initialisation

! ---------------------------------

Solution_algorithm                   2 ! 2-nonlinear static

 Maximum_number_time_steps            1

 Duration                           1.0

 Initial_time_step                  1.0

 Screen_message_frequency             1

 Output_frequency_plotfile           -1


1The Porous_control_data for stage 1 initialisation of the rock pore pressures requires only a single step analysis to be performed.

2The Solution_algorithm is set to 2 for nonlinear static in this initialisation stage.


Stage 2 Well activation and porous flow simulation

Data File


* Porous_control_data         ! Stage 2 Flow

! ---------------------------------

Solution_algorithm                   4 ! 4-nonlinear transient

 Maximum_number_time_steps          1E6

 Duration                           1.0

 Initial_time_step                 0.02

 Screen_message_frequency             1

 Output_time_plotfile               0.1

 Output_frequency_plotfile           -1  


1The Porous_control_data for stage 2 porous flow simulation requires the Solution_algorithm to be set to 4 to perform a nonlinear transient solution over 1 day of injection and production.

2A constant time step size of 0.02 is utilised (i.e. 50 time steps over the 1 day simulation duration).


Results


The result files for the project are in directory: ParaGeo Examples\General Examples\Ex_008\Case04\Results.


The plots below show the initial pore pressure distribution in the rock domain with prescribed top pressure of 30 MPa..


Ex_008_Case04_03


Initial pore pressure distribution in rock domain


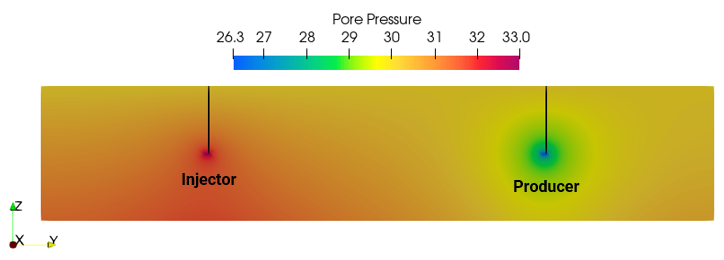
The plot below shows the pore pressure distribution at the final time step, highlighting the injector as the pressure source and the producer as the pressure sink.


Ex_008_Case04_04


Pore pressure distribution at final time step (mid-slice plot in X-X)


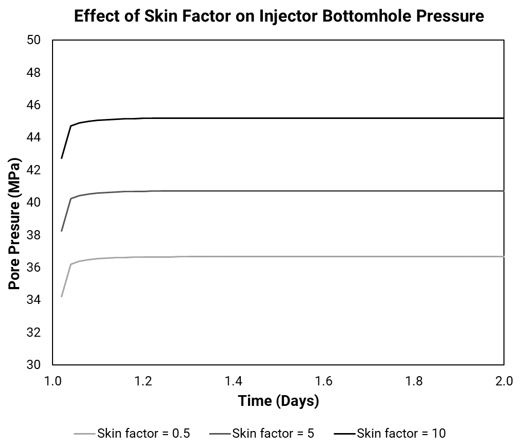
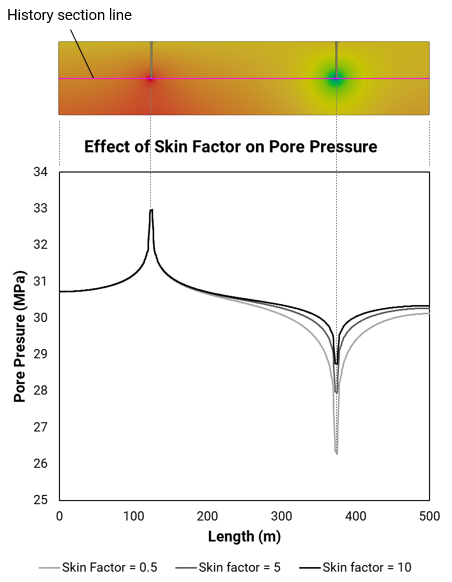
The impact of the skin factor is illustrated in the graphical plots below.  On the injector side where the flow rate is prescribed constant, a larger skin factor results in higher bottomhole pressure for a given background reservoir pore pressure.  This is necessary to overcome the additional flow resistance.  On the producer side where the bottomhole pressure is fixed at 20mPa, a larger skin factor results in higher reservoir pore pressure to overcome the flow resistance.


Ex_008_Case04_06b

Ex_008_Case04_06a


Bottomhole pressure at the Injector well


Pore pressure profile for the history section line (pink line) in the formation across the injector-producer well system