GeoInv_001 Case02 Inversion for two parameters
In the previous example, inversion for only one elastic property (i.e. Young's modulus) has been performed. In the present example, the inverse analysis additionally accounts for the recovery of Poisson's ratio. All the data is identical to the previous case except that within Parameter_data data structure keyword Type for "Poiss" is set to 0 (free parameter to be inverted). The data file is available in GeoInv_001\Case02\Data\GeoInv_001_Case02.inp.
Data File |
* Parameter_data ! ------------------------------- Name IDM=2 "Young" "Poiss" Type IDM=2 0 0 Value IDM=2 100 0.2 Minimum_value IDM=2 100 0.2 Maximum_value IDM=2 300 0.4 Variable_structure_name IDM=2 "Material_data" "Material_data" Variable_structure_number IDM=2 1 1
|
Results
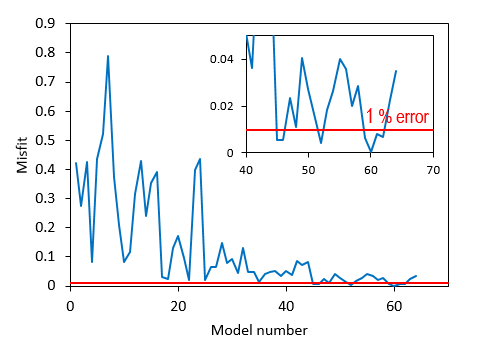
A number of 8 samples, comprising 64 models, have been required in order to achieve convergence. The inverse analysis was terminated when Model 60 was identified to satisfy the convergence criteria. It should be noted however that given the randomness of the inverted parameter values input for the generated models these results are only representative of the specific run used to generate the provided tutorial results. The result files for the project are in directory: GeoInv_001\Case02\Results.
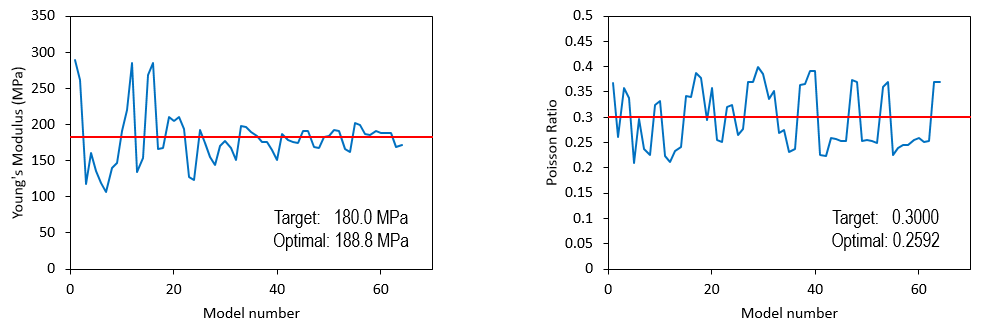
As can be seen in the pictures below the optimal value for Young's modulus is not exactly the value used for the target solution. Additionally the evolution of Poisson's ratio values during the inversion analysis show an oscillatory behaviour with the optimal value being notably away from the value used to generate the target solution. This behaviour may indicate either or both:
1.That there may exists more than one pair of inverted parameter values that satisfy the convergence criteria for the considered target solution (vertical displacement on a single point).
2.That in this particular case Poisson's ratio has a relatively low influence in the resulting vertical displacement.
This will be explored in Case03 by considering two cases with fixed values of Poisson's ratio which are not corresponding to the value used for generation of the target solution.
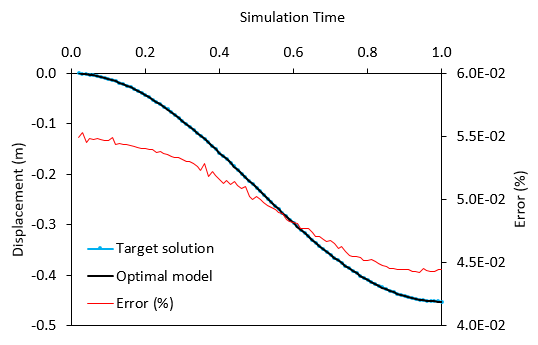
As can be seen in the comparison between the target an the optimal model solution the difference in the vertical displacement at the monitored point is negligible regardless of the difference between the optimal and target Poisson's ratio values.
Optimal Values for Young's Modulus and Poisson's Ratio
Reduction of misfit towards value lower than 1% error
Misfit Evolution
Nearest Neighbour algorithm searching for optimal Young's modulus
Comparison of Optimal Model and Target Solutions
Comparison between target and optimal solutions. Low percentage difference is observed.
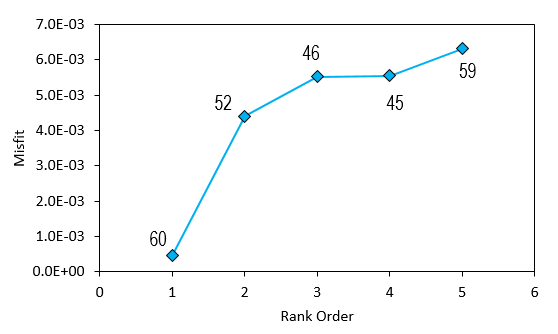
Summary of the best 5 models
The plot below shows that all the five best models for which results are kept yield misfit values lower than 1%.
Percentage misfit of the best 5 models with descending rank order. Numbers next to diamond markers indicate model number.
Users may refer to the ParaGeo data file used to generate target solution for more details (GeoInv_001\Reference_solution). In the following tables, the inverted parameters for the best 5 models are provided.
Recovered elastic properties and misfit value for the best 5 models
|


