Case03b 3D Large Irregular Grid Model with 'Ragged' Boundaries
The 3D large irregular grid model with 'ragged' boundaries presented here is extracted from the basin model at the highlighted location in white outline. A full description of the geomechanical restoration and forward simulation for this 3D large irregular grid model will not be described as the simulation workflow is exactly the same as that for the Case03a small irregular grid model, therefore only the differences will be briefly presented here. To this end, it is recommended to familiarise with the Case03a - 3D Small Irregular Grid Model before undertaking this example.
Simulation runs on a single 3.6GHz AMD Processor PC for Case03b large 3D irregular grid model comprising 442,353 nodes, 421,025 elements took:
•Restoration - 6 hours 33 minutes.
•Forward Simulation - 16 hours 12 minutes.
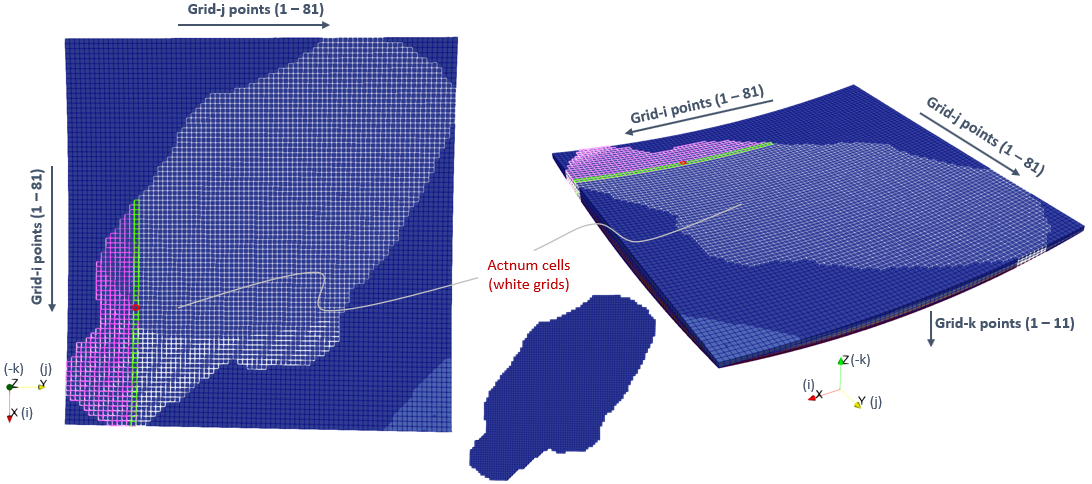
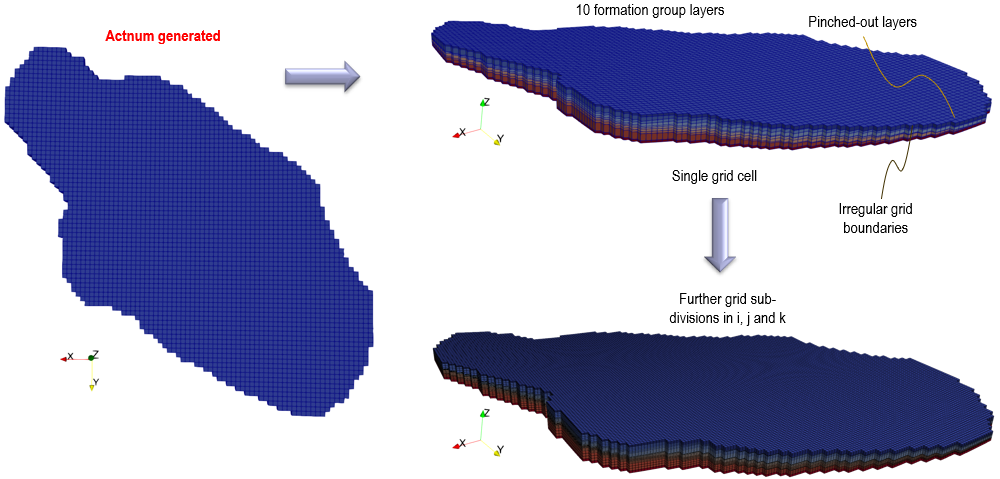
3D Large Irregular Grid Model located at full Actnum cells in Geol_002 Basin Model with 80 x 80 grid cells (1 cell = 1km)
The differences to the Case03a small irregular grid model in addition to the Case## ID updates are briefly summarised here:
1Step 01 - Zmap file import and outut to ParaView plot file and Abaqus input .inp file. Files are in Geol_002\Case03b\01 - Zmap import.
▪Geol_002_Case03b_geom.dat: Since the full 'actnum' active cells define the model. Sub_grid_dimensions data is no longer required to be defined.
2Step 02 - Conversion of .inp file to suitable ParaGeo geometry (.geo and .geometry) files and data .dat file. Files are in Geol_002\Case03b\02 - Geometry creation.
▪Geol_002_Case03b_rest.inp: No other updates required apart from the Case## ID.
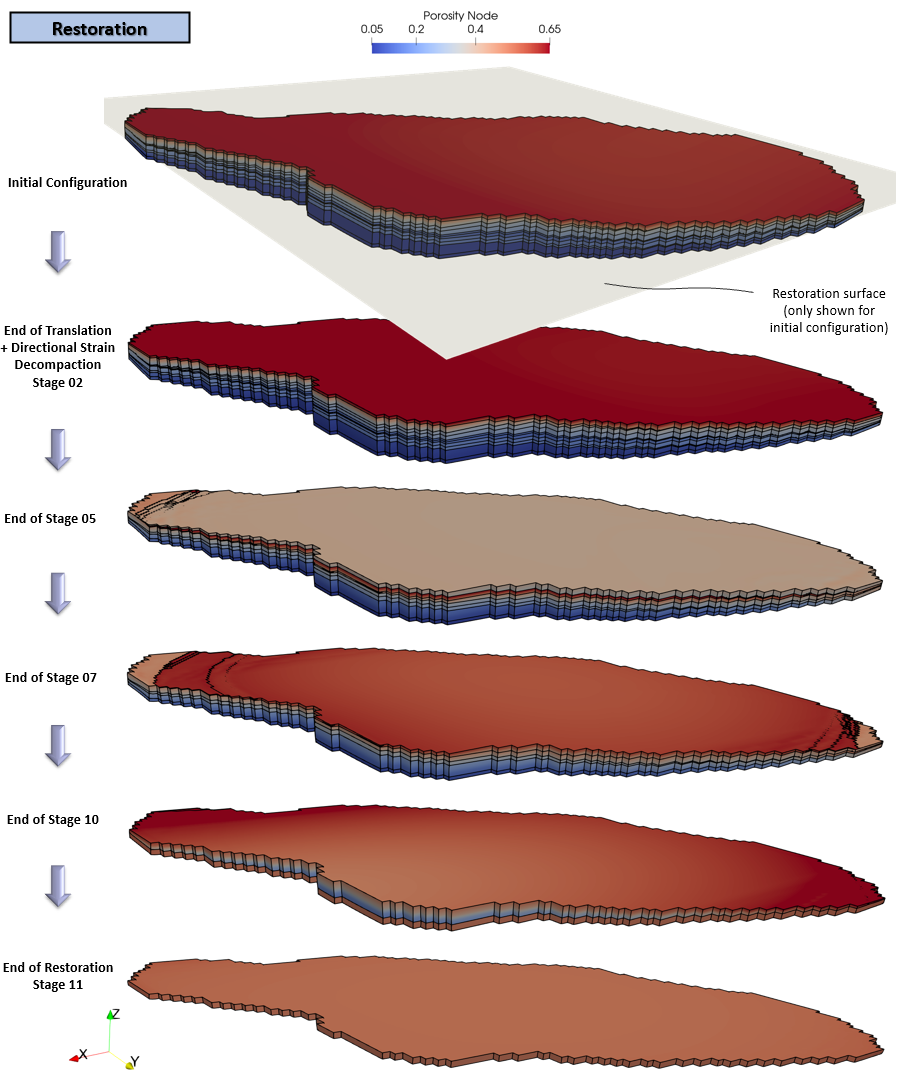
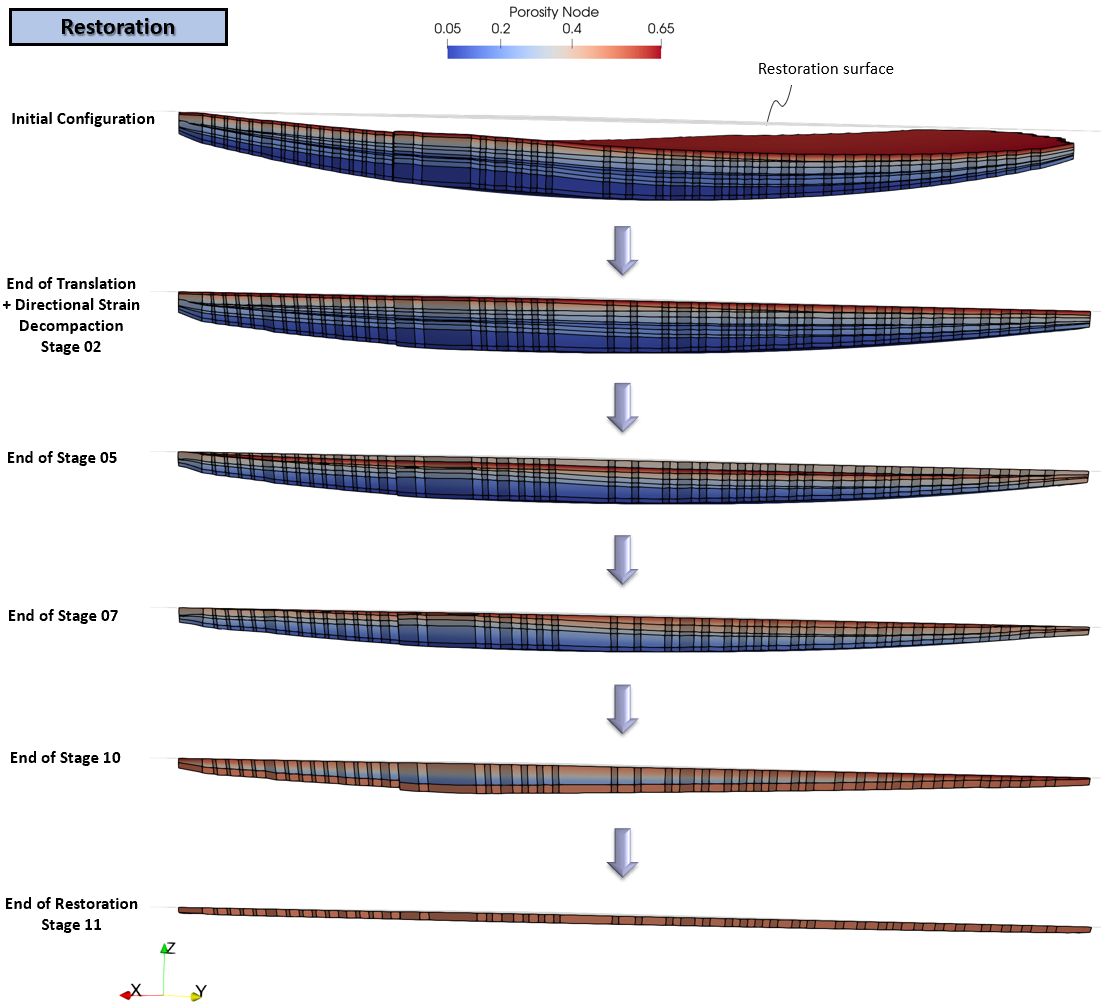
3Step 03 - Geomechanical restoration of the defined 3D geological structure with directional strain decompaction. Files are in Geol_002\Case03b\03 - Restoration.
▪Geol_002_Case03b_RestSurf01.dat: The X and Y coordinates are updated to encompass the lateral boundaries of the large model. Z=8700m is still valid, so no change required.
▪Geol_002_Case03b_Directional_Strains.spat: The X and Y coordinates are updated to encompass the lateral boundaries of the large model. The Z-coordinate bounds are still valid, so no change required.
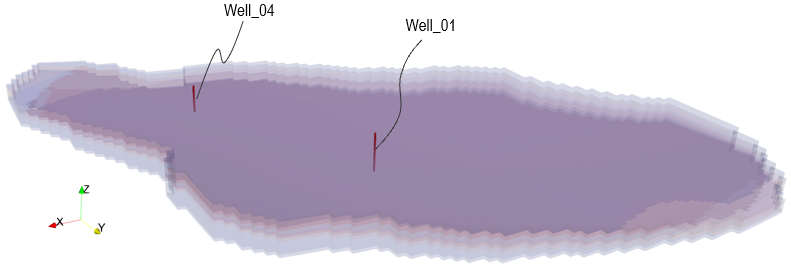
▪Geol_002_Case03b_rest.dat: History section line data for notional 'Well_04' replaces notional 'Well_03' to output porosity at this new well location (Optional). Note that other user-defined well location(s) can be selected and requested for outputs.
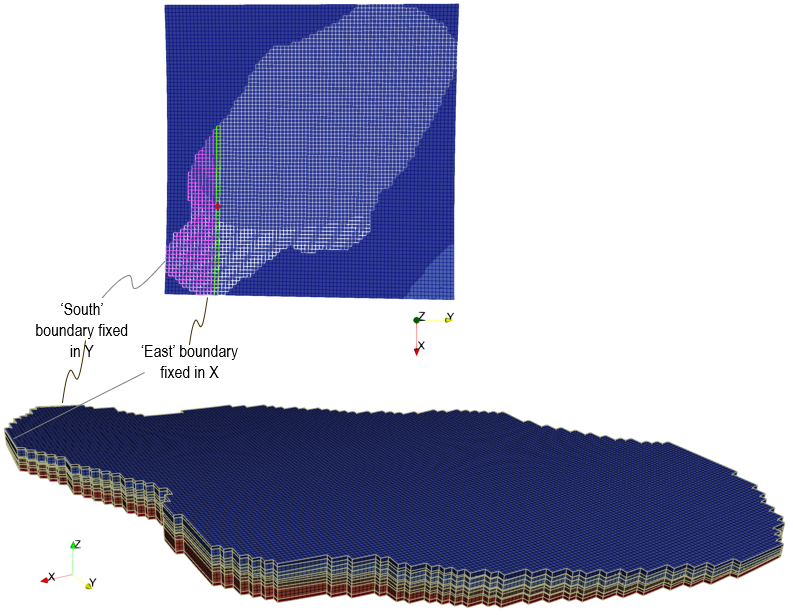
4Step 04a - Extraction of side boundary nodes for 'ragged' boundary models. Files are in Geol_002\Case03b\04a - Boundary Extract.
▪ Geol_002_Case03b_extract_hex_sidebound.dat: No other updates required apart from the Case## ID.
5Step 04 - Forward simulation of the sedimentation process (THM modelling). Files are in Geol_002\Case03b\04 - Forward simulation.
▪Geol_002_Case03b_fwdsim.dat: Two history section line data ("las" and "hdh" formats) for notional 'Well_04' replaces notional 'Well_03' to output selected variables at this new well location (Optional).
The following individual steps contain figures relevant to each step including results.
The results output from Step 01 are shown in the figures below.
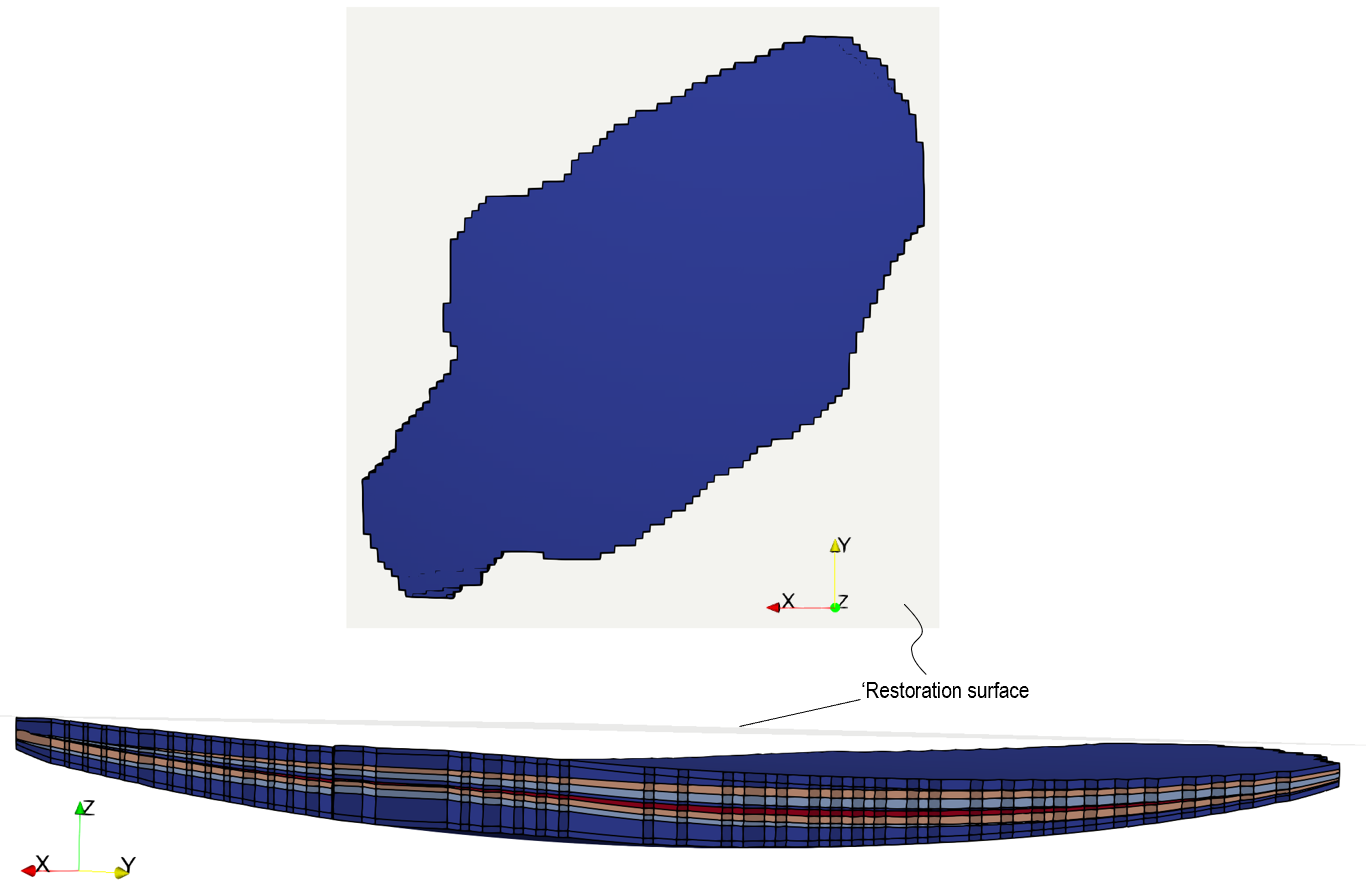
Extraction of Large Irregular Grid (Sub-) Model from 'Actnum' Geol_002 Basin Model and Discretisation of Grids in i, j, k
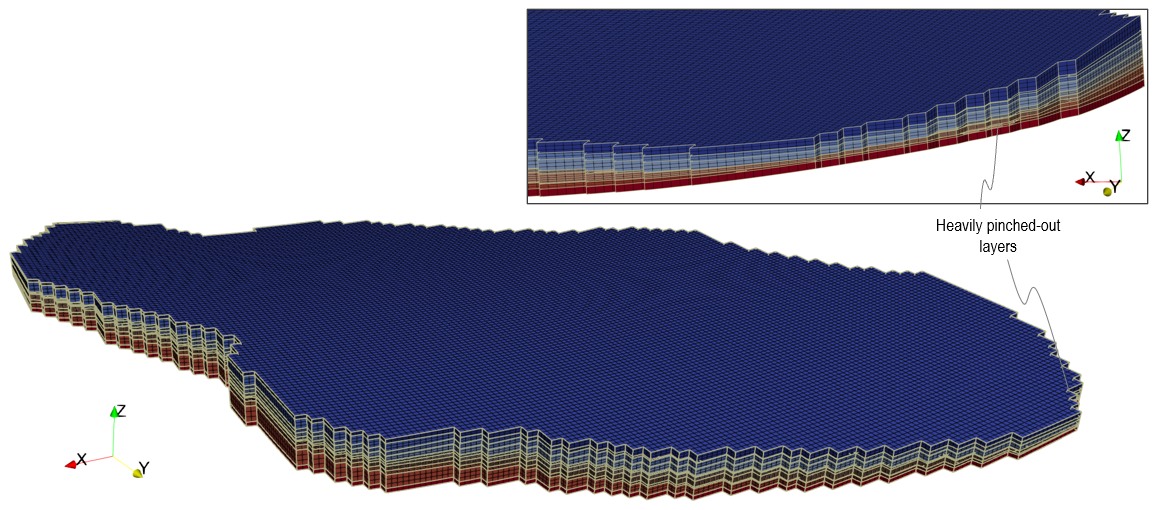
The ParaView grid geometry from the extracted Zmap import/output (Step 01) and the ParaGeo hex mesh from Step 02 is shown by the same figure below.
Extracted Large Irregular Grid Model from Zmap Import (Geol_002_Case03b_geom_update_eclipse.xmf, .ecl) & ParaGeo irregular grid model hex mesh (Geol_002_Case03b_rest_mesh.xmf) |
|
The results of the forward simulation for the large irregular grid model are presented here. Results of the high definition history files for the output variables in "Well_04" have been processed into the excel file 00_Geol_002_Case03b_Results.xlsx. Some of the graphical plots are presented at the end.
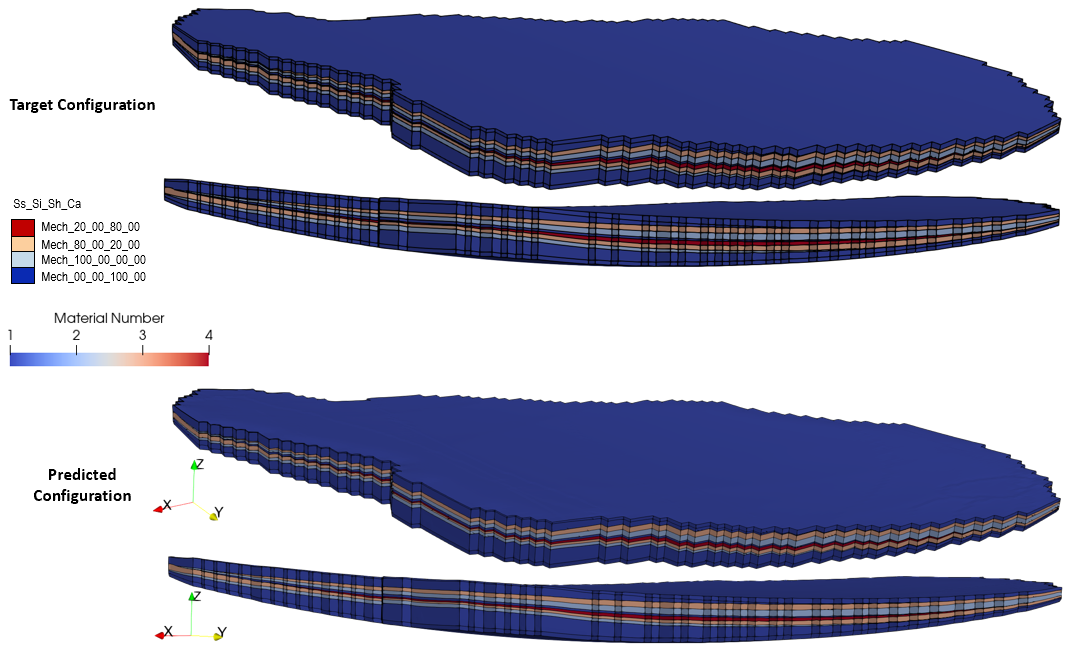
A comparison of the target configuration and the predicted forward model configuration show very good correlation achieved in all bar the top layer (i.e last deposition layer). This is expected due to the inconsistency in the initialization of the top layer to the NCT during forward simulation whereas in the restoration, decompaction to "Top_layer" following the NCT starts in the second restoration stage. "Continuous" decompaction can only be defined for the first restoration stage (after geostatic initialization) due to directional strain decompaction happening at the same time.
Comparison of target configuration and predicted forward model configuration (nb: plots are of material number)
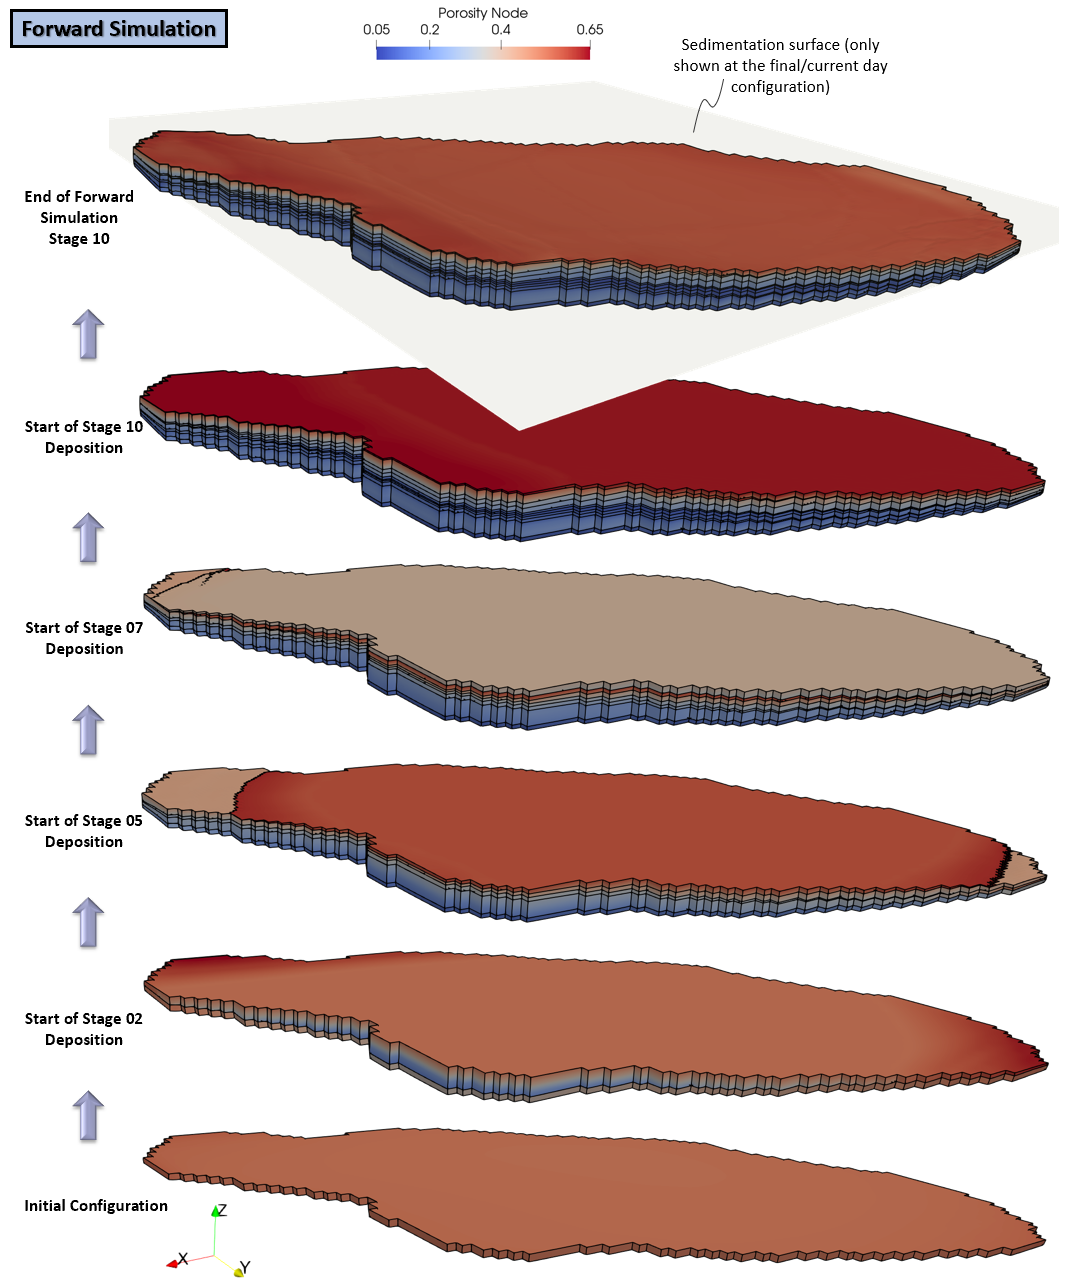
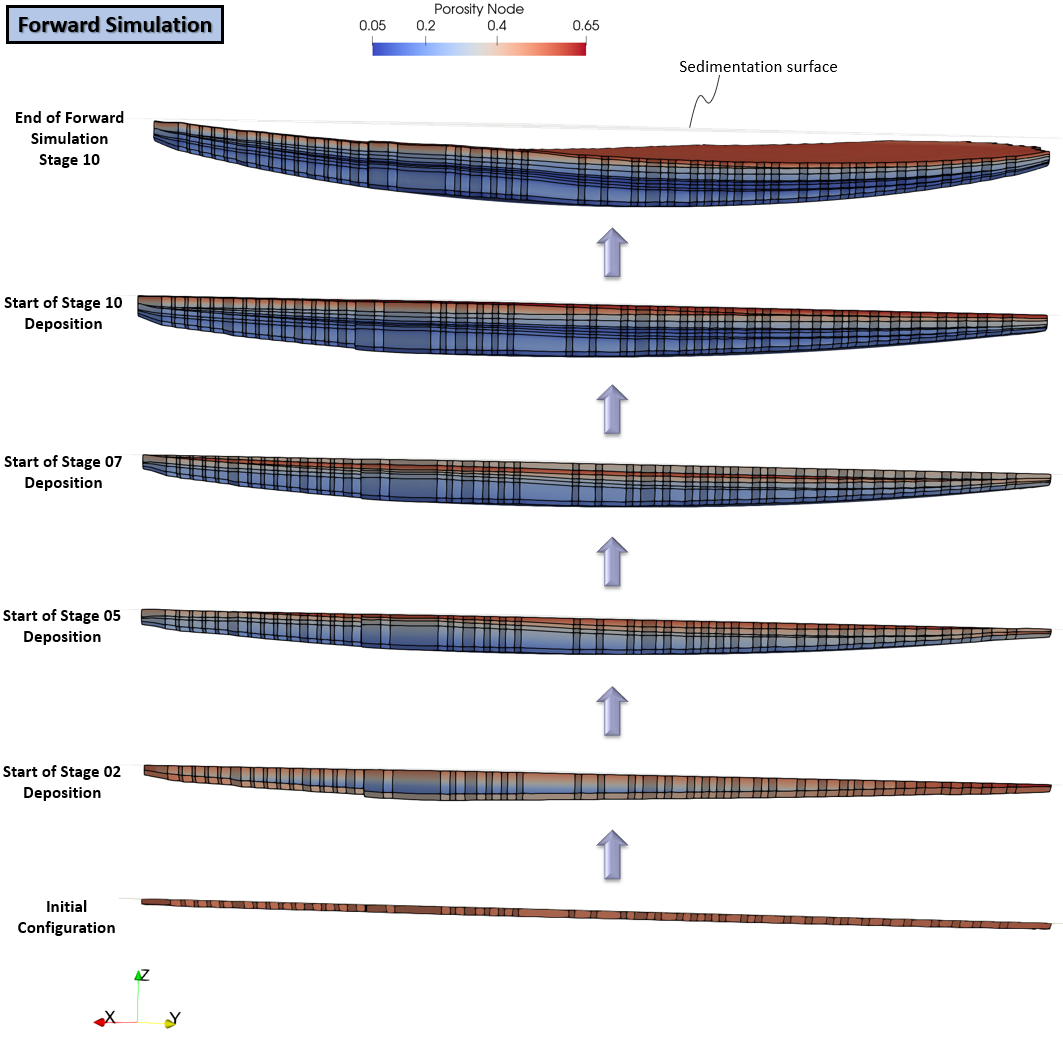
The figure below shows the evolution of porosity plots in the generated forward model from initial configuration to end of deposition stage. Two different display views are presented. These can be compared against the evolution plots of the restoration process presented in Step 03.
Evolution of porosity in the generated forward model from initial configuration, various stages of deposition to end of forward simulation at t=120 Ma
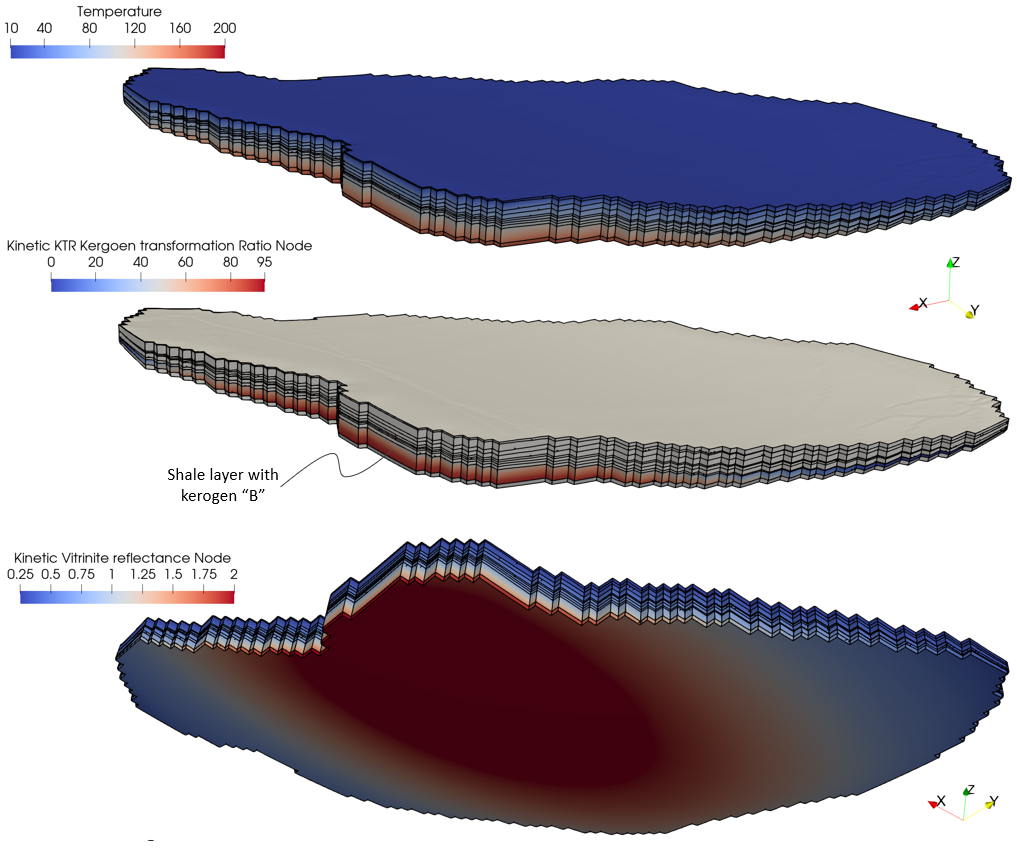
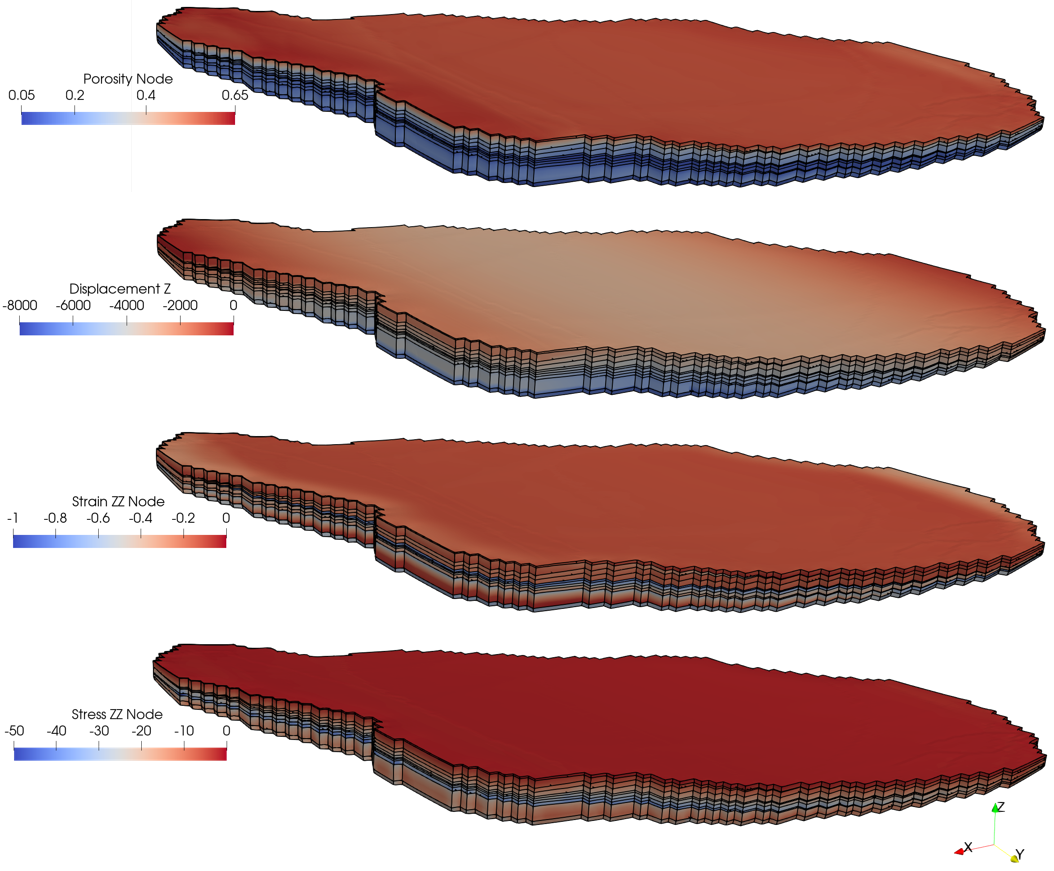
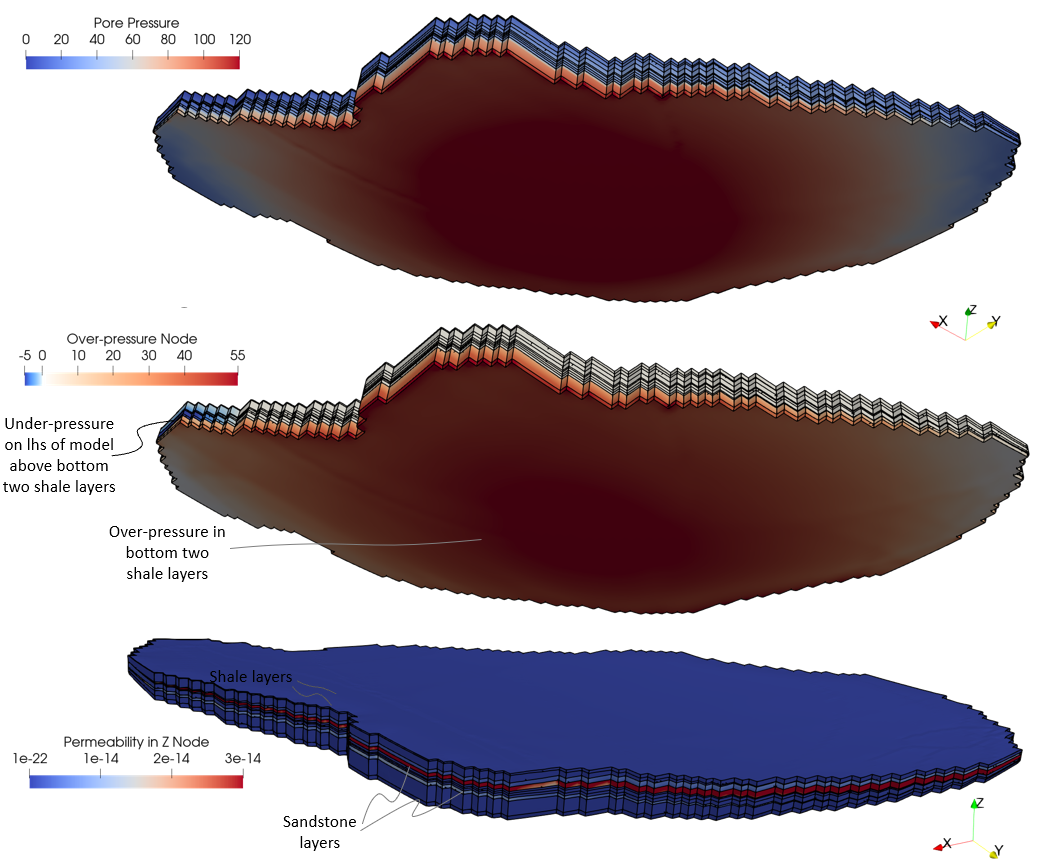
The figures below show the distribution of temperature, kinetic KTR, kinetic Vitrinite reflectance, porosity, displacements in Z, strain in ZZ, stress in ZZ, pore pressure, over-pressure and permeability in Z. The basal thermal flux loading has resulted in increase in temperature up to c.a. 207°C at the base and c.a. 189°C in the kerogen formation02 layer, which is sufficient to produce a kinetic KTR percentage of 96% transformation. Over the simulation duration of 120Ma, over-pressures up to c.a 57MPa have developed predominantly in the bottom two shale layers with under-pressures up to 7MPa on the East end of the model in the three adjacent layers (sandstone layers 03 and 07 and 80% sandstone layer 04 sandwiched in between). Permeability in Z is observed to be highest in sandstone layer 07.
Distribution of variables in generated forward model. Variables include Temperature, Kinetic KTR, Kinetic Vitrinite Reflectance, Porosity, Displacement in Z, Strain in ZZ, Stress in ZZ, Pore Pressure, Over-Pressure and Permeability in Z
The graphs below show plots of porosity, pore pressures and stresses along the notional 'Well_04' line. The comparison plots of porosity between the target and the generated forward model show greater deviation in the bottom two shale layers. As observed in the pore pressure plot, this is due to over-pressures generated which are highest in these two layers. The vertical and horizontal effective stresses have reduced at these lower levels to compensate for the increase in pore pressure. Notice the over-pressures are observed in the higher content shale layers (80% and 100% shale). The locations of the layers are highlighted with the dotted lines at their respective depths.
Porosity, Pore Pressure and Stresses at end of forward simulation stage
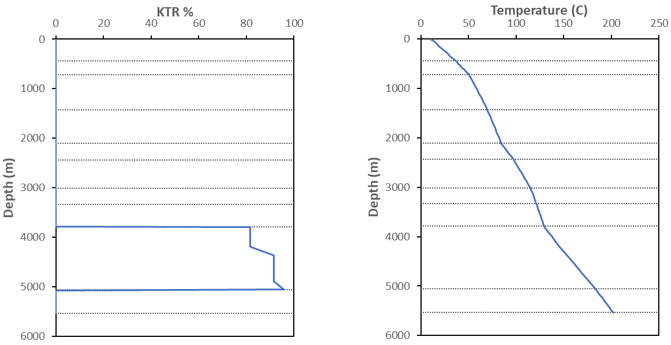
The graphs below show plots of kinetic KTR and temperature along the notional 'Well_04' line. As expected, the kerogen formation02 layer shows hydrocarbon expulsion with kinetic KTR of 82 - 96% at temperatures of 130 - 183°C.
Kinetic KTR and Temperature distribution at end of forward simulation stage
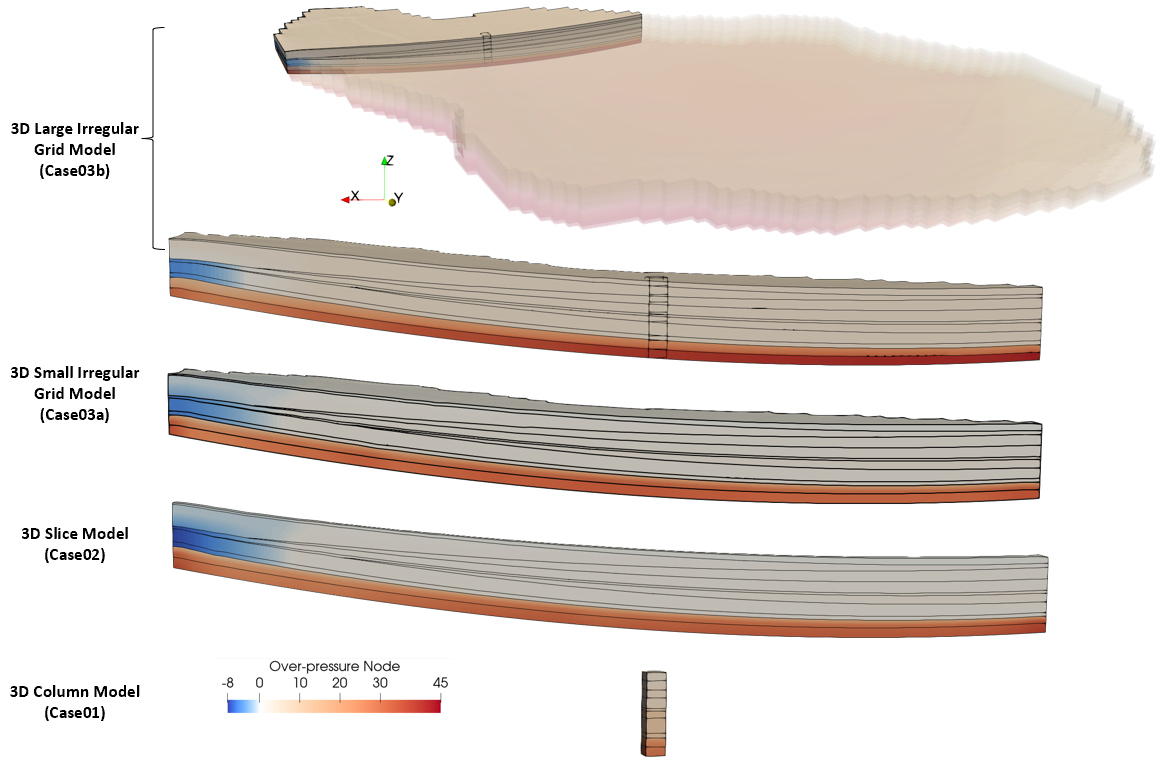
The figures below show a comparison of the over-pressures between the different models. The results of the column, slice, small and large 3D irregular grid models all show a similar trend with under-pressures on the East end of the model in the three adjacent layers (sandstone layers 03 and 07 and 80% sandstone layer 04 sandwiched in between) and over-pressures in the bottom two shale layers.
Comparison of over-pressures for the different models (Case01 - Column, Case02 - Slice, Case03a - Small 3D, Case03b - Large 3D) |
|

