Case 2 Permeability = 1E-19m2

Contents
Overview
The objective is to repeat the Case1 simulation but with a permeability (k) of 1.0E-19m2. This is achieved simply by copying the Case1 data file to a new name hm_002_Case2.dat and modifying the data:- Change the Permeability keyword value in the Material_data data structure to 1.0E-19.
The example data is provided in HM_002\Case2\Data\hm_002_Case2.dat.
Results
The result files for the project are in directory: HM_002\Case2\Results. The high definition history files are displayed graphically in the excel file HM_002\00_hm_002.xlsx "hm_002_Case2" worksheet.
The evolution of pore pressure and effective vertical and horizontal stresses are shown below. The predicted maximum overpressure at the base of the column is ca. 6.56 MPa which is higher than the analytical prediction of 5.17 MPa. This is expected and is due to the longer drainage path (always ca. 1000m) associated with the pre-existing sediment assumption rather than in reality whereby the drainage path from the base of the model to the free surface gradually increases from zero to 1000m over the deposition time.
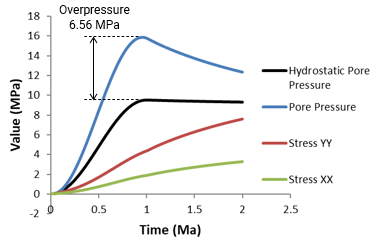
Pore Pressure Evolution at the Base of the Column as a Function of Time
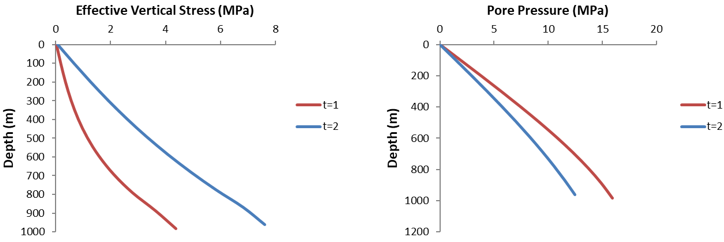
Effective Vertical Stress and Pore Pressure with Depth at t = 1Ma and t = 2Ma