DPDK_2 corridor model
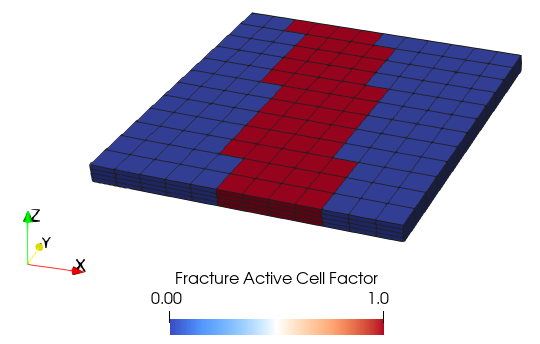
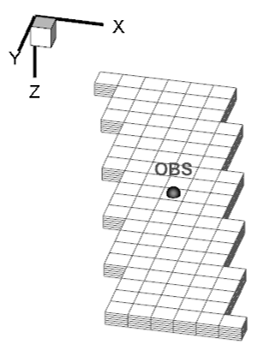
This case as DPDK_1 also consider dual porosity dual permeability (DPDK). The difference is that in this case fractures are only present on a fracture corridor. Below there is an example of the ParaGeo and IX cells which are fractured. Note that the fractured cells are defined in IX and mapped to ParaGeo so the ParaGeo datafile is identical to the DPDK_1 data.


ParaGeo (left) and IX (right) meshes with fractured cells.
Results
The result files for the project are in directory: IX_002\DPDK_2\Results
The present case considers the same material and fracture properties as DPDK_1 case with the difference that fractures are only present to certain cells of the reservoir forming a fracture corridor as shown above. Here the relevant results compared to previous cases are discussed.
The plots below show the comparison of pore pressure evolution at the three well locations for the SPSK_1, DPDK_1 and DPDK_2 corridor model cases. It can be seen that provided that fractures enhance permeability only in certain locations of the reservoir, the results are between the two end members SPSK_1 and DPDK_1 models.
Comparison of pore pressure evolution at the three well locations for SPSK, DPDK and DPDK corridor cases.
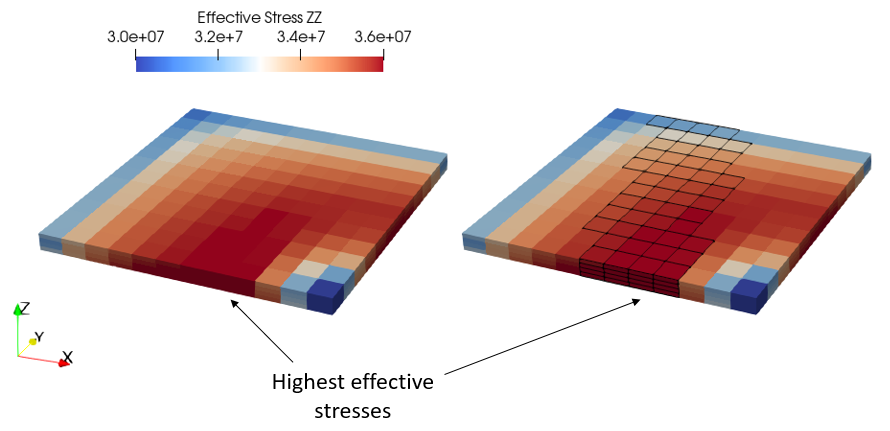
In the figures below the vertical effective stress distribution at the end of the simulation for the SPSK_1, DPDK_1 and DPDK_2 corridor model cases is shown. As can be seen the stress magnitudes for the present case in which fractures form a corridor are mainly between those for the two end member cases SPSK_1 and DPDK_1. Nonetheless it should be noted that the stress distribution for the present case is not symmetric as for the other cases due to the influence of the fracture corridor shape. This can be seen in the image below plotted at a different range for the sake of facilitating visibility of the zone with maximum stresses. It can be seen that the maximum stresses are located at the minimum Y coordinate in fractured cells near the producer well location. During production the corridor of fractures facilitated relatively rapid fluid flow from locations near the injector to locations near the producer. Then after shut down during pore pressure equilibration there is more fluid flow from the fractured cells to the producer location than from the adjacent non-fractured cells, and hence there is a larger increase in stress.
Comparison of vertical effective stress distribution in the reservoir for SPSK_1, DPDK_1 and DPDK_2 corridor cases.
Vertical effective stress distribution in the reservoir for the DPDK_2 corridor model. The picture on the right shows the fractured cells for reference.
|


