Case03 Kerogen layer thickness
The present case is a variation of Case02 with the first two layers in the column model containing kerogen 'B' and the fourth and fifth layers containing kerogen 'F', with a non-kerogen layer sandwiched in between the kerogen layers. The only difference in this example is the definition of kerogen layer thickness of 200m for both kerogen property sets. This example serves to demonstrate the influence of the kerogen layer thickness.
It is recommended to undertake Case02 beforehand. The data is identical to the Case02 data with the addition of the kerogen layer thickness defined in the two Kerogen_kinetics data structures. The data file for the project is in : Kin_001\Case03\Data.
Data File (.contact) |
|
* Kerogen_kinetics NUM=1 ! --------------------------------- Name "kerogen1" Kerogen_facies_type "B"
(.....)
Thickness 200.0
* Kerogen_kinetics NUM=2 ! --------------------------------- Name "kerogen2" Kerogen_facies_type "F"
(.....)
Thickness 200.0
|
1Kerogen property name "kerogen1" has layer thickness defined as 200m. 2Kerogen property name "kerogen2" has layer thickness defined as 200m.
|
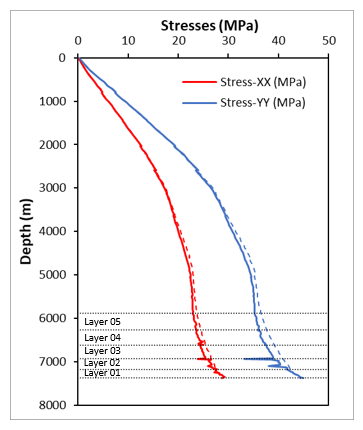
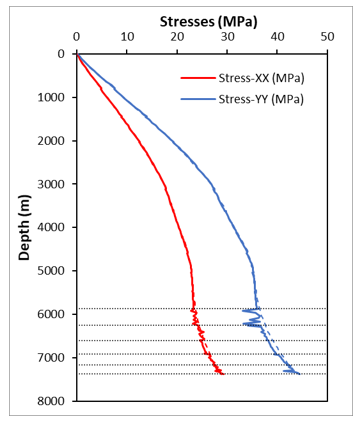
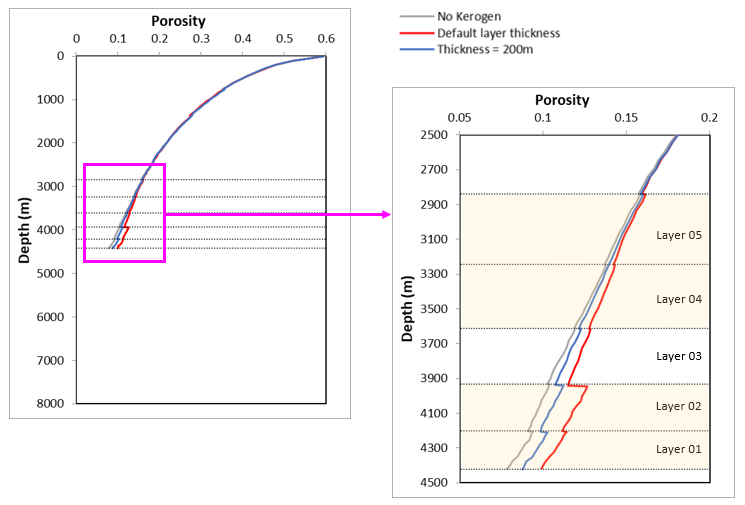
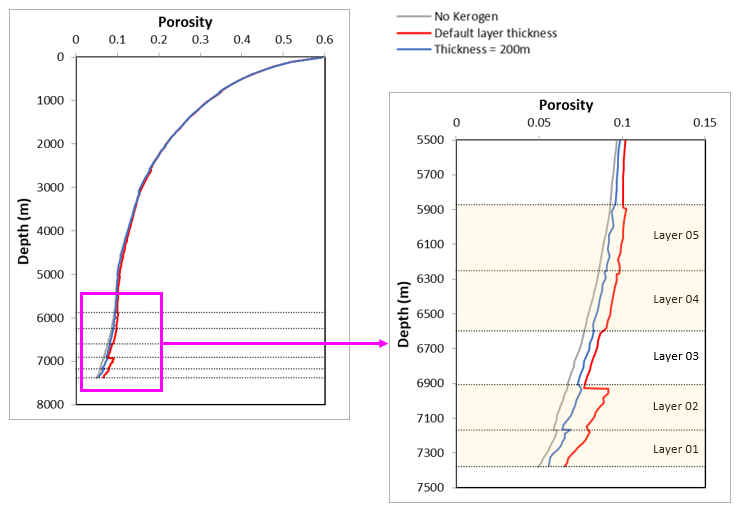
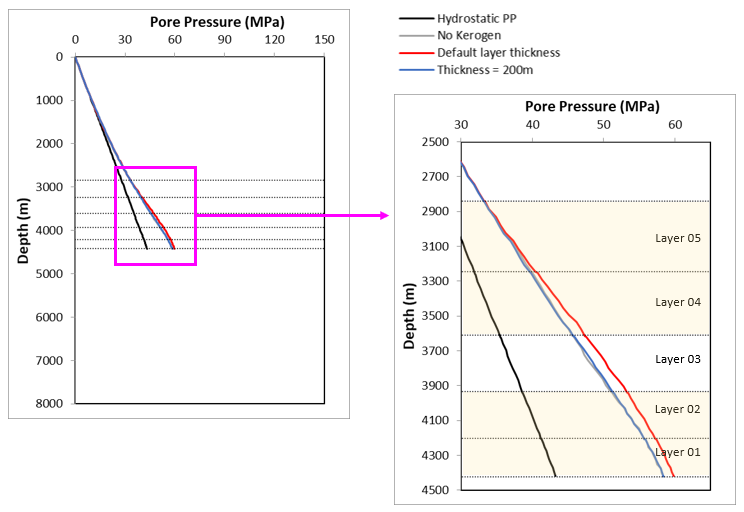
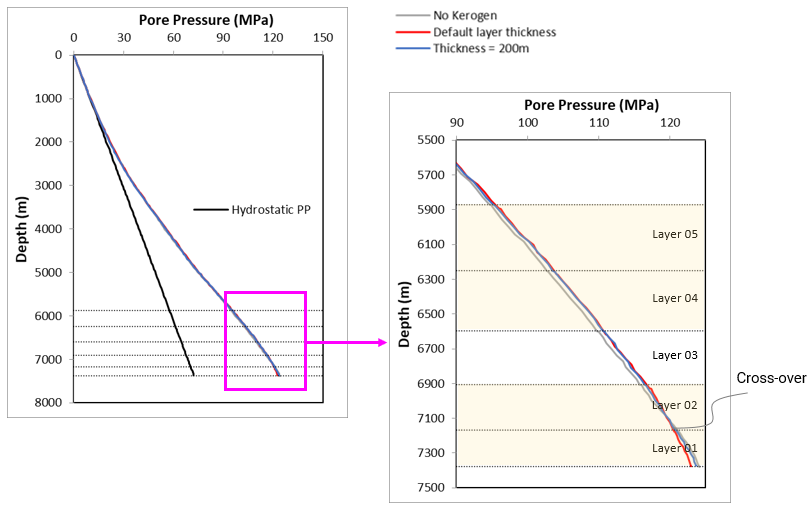
The result files for the project are in directory: Kin_001\Case03\Results. Results of the high definition history files for the output variables including the hydrocarbon kinetic state variables have been processed into the excel file 00_Kin_001_Case03_Results.xlsx. Some of the graphical plots are presented here. The influence of the kerogen layer thickness is presented here with comparison reference to the Case02 example with default kerogen thickness = layer thickness. •Case02 - kerogen thickness = layer thickness. •Case03 - kerogen thickness = 200m.
As expected, when the kerogen layer thickness is reduced to 200m, the stress reduction in the kerogen layers is also decreased.
As expected, the kerogen thickness comparison plots of porosity shows a reduced porosity change when the kerogen layer thickness is reduced.
The kerogen thickness comparison plots of pore pressure at t=75Ma shows almost no change from the no kerogen case - this could be attributed to a combination of effects from increase due to hydrocarbon transformation and further compaction due to weakening of rock and decrease due to the higher permeability associated with porosity increase. By the end of the simulation at t=120Ma, any overpressures generated have almost all dissipated, although there is subtle evidence of the results for the thickness=200m case (blue line) sandwiched in between the no kerogen case (grey line) and the default kerogen layer thickness case (red line).
|
||||||||||||||||||

