Case 2 Characterization of Experimental Data (Linear Elasticity)
In the previous example the basic constitutive behaviour of four tests at different confining pressures for a weakly cemented sandstone modeled by means of the SR4 model has been illustrated. In this case experimental data for a weakly cemented sandstone will be used to calibrate SR4 parameters. The data is provided in the spreadsheet "mat_001_Case2.xlsm". Experimental data comprises four Confined Triaxial Compression tests (CTC) at different confining pressures.
In this case Linear Elasticity (constant Young's Modulus) plus SR4 plasticity will be used to represent the constitutive response of the material.
The material file "mat_001_Case2.mat" contains most of the material data to perform the simulations. Look for ! TODO text in the material file and follow the instructions.
| Problem Description |
The geometry, initial conditions, boundary conditions and problem definition are identical to Case 1.
|
| Description of Basic Set Up |
The data files for the project are in: mat_001\Exercises\Case2\Data. Four cases are considered which correspond to the four experimental test performed at different confining pressures:
•0.34 MPa confinement - mat_001_Case2_0p34MPa. •1.72 MPa confinement - mat_001_Case2_1p72MPa. •6.9 MPa confinement - mat_001_Case2_6p9MPa. •24.1 MPa confinement - mat_001_Case2_24p1MPa.
The primary data for the simulation is identical to Case 1.
|
| Experimental Data and Exercise |
Experimental Data The experimental data which corresponds to a weak sandstone is provided in the spreadsheet "mat_001_Case2.xlsm". The four experimental test correspond to CTC tests at different confining pressures. The plots below show the Stress-Strain plots and Stress-Dilatancy plot. Those plots consider positive values for compression and negative values for extension/dilation (the opposite that the code uses). It can be noted that:
1.Tests with confining pressure 0.34 MPa, 1.72 MPa and 6.9 MPa show a brittle and dilative response; i.e: a.A peak strength is reached in strain-stress plots after which strength decreases (softening) until reaching a residual strength value b.Volumetric strain plot shows initial elastic volume reduction followed by plastic volume increase c.Stress-dilation plots shows a period dilation as shear increases (negative values of dEv/dEs)
2.Test with 24.1 MPa confining pressure shows a ductile and compactive response; i.e: a.After yielding there is no clear strength reduction b.The volumetric strain plot shows post-yielding volume reduction c.The stress-dilation plot remains always on the compression side (positive values)
3.As confining pressure increases peak strength also increases
4.As confining pressure increases the stiffness increases (higher slope on the elastic part of strain-stress plots)
Plots from experimental tests
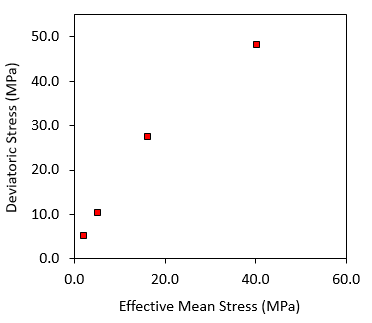
Exercise In this exercise the objective is to define the yield and flow surfaces using the provided experimental data for calibration. The figure below shows peak stress data in the p' -q plane derived from the experimental results. The spreadsheet can be used to input Yield surface parameters and match the data. The material file "mat_001_Case2.mat" contains most of the material data to perform the simulations except the following plasticity parameters which should be input by the user:
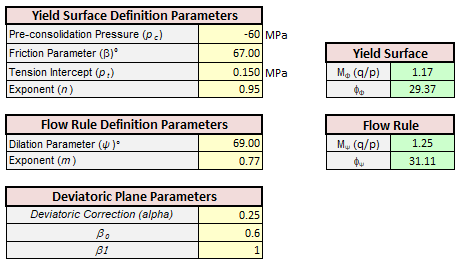
•Tensile intercept (pt) •Pre-consolidation pressure (pc) •Friction parameter •Dilation parameter •Yield exponent (n) •Flow potential exponent (m)
Peak stress data derived from the experiments
Hint: The post-yield behaviour observed in the experiments is key in choosing the assumptions for calibration.
|
The result files for the project are in directory: mat_001\Exercises\Case2\Results. The history results can be pasted into the Excel file mat_001_Case2.xlsm.
Characterisation of SR4 parameters The yield surface and the flow potential parameters are defined taking into account the following considerations: 1.The brittle response of tests with confining pressures 0.34 MPa, 1.72 MPa and 6.9 MPa are typical of over-consolidated sediments. Therefore the yield surface is defined so that the experimental peak strength points for those cases define the shear side of the initial yield surface. 2.The experimental peak strength for the test with 24.1 MPa must be reached by yielding on the cap side of the yield surface (i.e. the triaxial stress path with slope 3/1 starting at 24.1 MPa on the p' axis must intersect the yield surface on the cap).
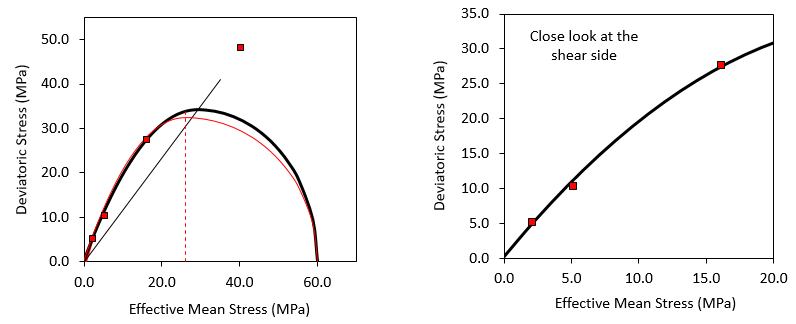
The proposed material parameters defining the SR4 surfaces are defined in the table below and the shape of the yield surface is shown in the accompanying figures. As can be seen, the chosen yield surface parameters lead to a reasonable good fit of the experimental data with the shear side of the yield surface which defines the over-consolidated strength. On the other hand the fourth peak stress data point is left outside of the initial yield surface as it corresponds to the test with a confining pressure of 24.1 MPa for which the peak stress is reached after ductile yield (yield on the cap side). The flow potential is defined so that the peak stress data point for the ductile test is on the cap side of the yield surface once its size is increased fitting the point (i.e. showing a hardened post yield state).
Calibrated Yield and Flow surface parameters
Calibrated initial Yield and Flow surfaces compared with experimental data.
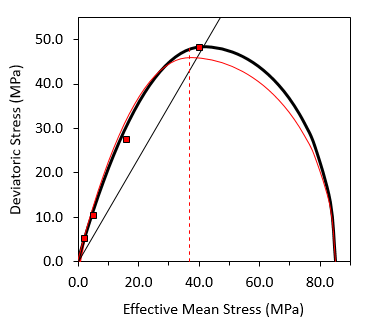
Yield surface shape for a pc of 85 MPa
Simulation Results The figures below show the stress vs. strain curves and the stress dilatancy plots for the experimental data (thin solid curves) and the simulation results (thick discontinuous lines). It can be seen that:
1.The simulation considered linear elasticity defined by a Young's modulus of 1000 MPa and a Poisson's ratio of 0.25. Therefore the slope of the elastic path in strain stress curves is the same in all simulations.
2.Stiffness is properly captured for case with 0.34 MPa confining pressure but as confining pressure increases, the difference between the simulation and the experimental data also increases. This is due to the poroelastic response observed in experiments (increasing stiffness with increasing confining pressure).
3.Peak strength for case with 6.9 MPa confining pressure is properly captured. This is because the proposed yield surface achieved the best fit for such data point.
4.The simulated post yield behaviour agrees with the experimental observations (i.e. simulations for confining pressures of 0.34 MPa, 1.72 MPa and 6.9 MPa show dilative response with softening whereas simulation with confining pressure of 24.1 MPa show compactive behaviour with hardening).
Results for all confining pressures
Results for the 0.34 MPa confining stress test
Results for the 1.72 MPa confining stress test
Results for the 6.9 MPa confining stress test
Results for the 24.1 MPa confining stress test
|


