Case 1 Simulation of Triaxial Tests with the SR4 Model
This case considers simulation of four triaxial tests with different confining pressures. A material characterisation typical of weakly cemented rock is used and the charactistics of the predicted response is discussed
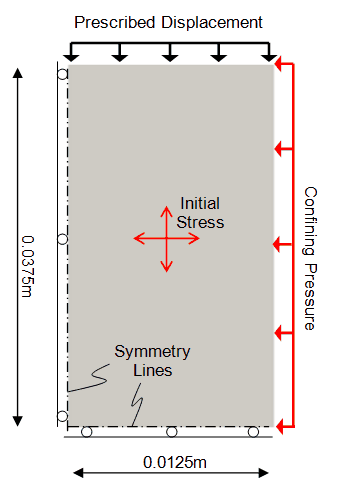
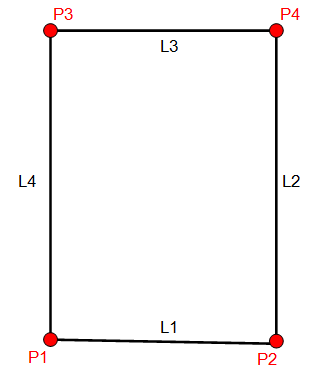
The specimen is a cylinder 75mm high by 25mm diameter. An axisymmetric representation is used with an additional symmetry line at the half-height of the specimen. The geometry of the specimen in the model is therefore 37.5mm high by 12.5mm radius. The initial conditions are fixed top surface, which is in contact with the loading platen, and a hydrostatic stress corresponding to the confining pressure. The hydrostatic stress is defined via an initial stress and a corresponding surface load on the side-wall of the specimen. The geometry of the specimen is defined by a single geometry surface.
|
The data files for the project is: mat_001\Data. Four cases are considered: •1 MPa confinement - mat_001_case1_1MPa. •3 MPa confinement - mat_001_case1_3MPa. •6 MPa confinement - mat_001_case1_6MPa. •12 MPa confinement - mat_001_case1_12MPa. The primary data for the simulation comprises 1A single group "Sand" (Group_data) which is assigned the "Mat_001_sr4" properties defined a being dry (Porous_flow_type = 1). 2Material data which is defined in the material file mat_001\Data\mat_001_sr4.mat (see Material Properties section for discussion). 3A hydrostatic initial stress defined using Geostatic_data and balanced by the confining stress defined in load case 1 (Global_loads). 4A vertical prescribed displacement with a linear ramp (Load_curve_data) assigned to line 3 in load case 2 (Global_loads). 5Time scaling data (Time_scaling_data) with target time step 1E-4s, giving approximately 1,000 steps for the simulation. 6Support data (Support_data) defining the base (line 1) and top surfaces (line 3) as fixed in Y-Direction, and the centre-line as fixed in the X-direction. 7History output data for a point on the top surface of the specimen. Note that as one element is used the stresses are constant for the specimen but the vertical displacement varies linearly from top to bottom. 8Mesh control (Mesh_control) and structured mesh generation data (Structured_mesh_data) defining a single element mesh. 9Control data (Control_data) defining: (a) Transient solution algorithm (Type 1), (b) Termination time of t=1.0s, (c) Factor of critical time step = 0.7 i.e. lower than the default value, (d) Plot file output every 0.25s,.
|
The material characterisation corresponds to a weakly cemented rock represented by the SR4 elastoplastic model together with linear elasticity. The material data is defined in file mat_001\Data\mat_001_sr4.mat. which was exported from ParaGeoMDB (Database: training, Material: mat_001_sr4).
Basic Material Parameters The basic material parameters are:
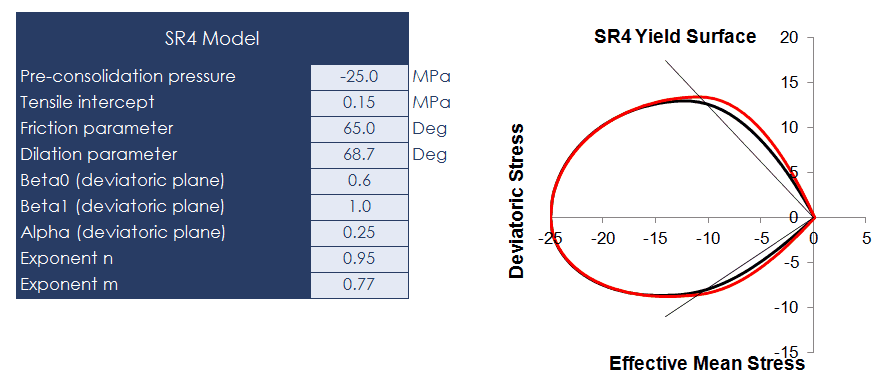
SR4 Material Characterisation Yield Surface and Flow Potential The material parameters defining the SR4 model are defined in the table below and the shape of the yield surface is shown in the accompanying figures.
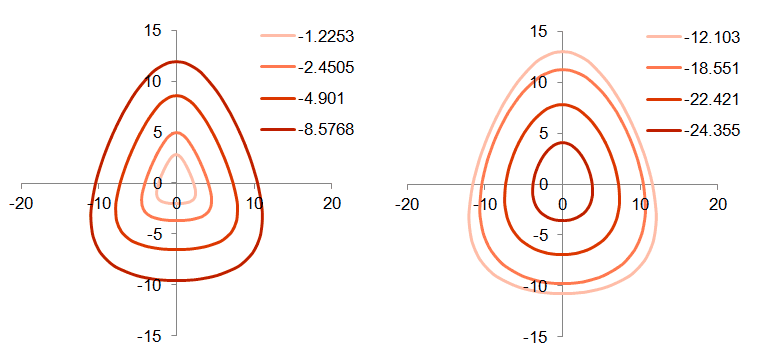
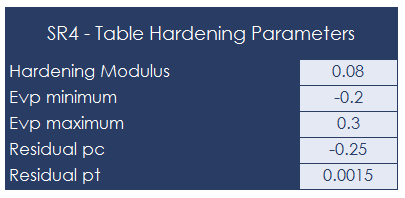
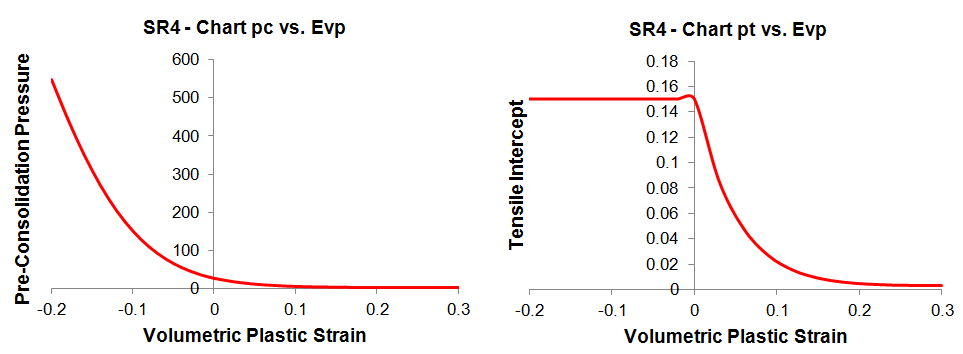
Hardening Law The hardening parameters are defined in the table below and the shape of the hardening curves for pc and pt are shown in the accompanying figures.
|
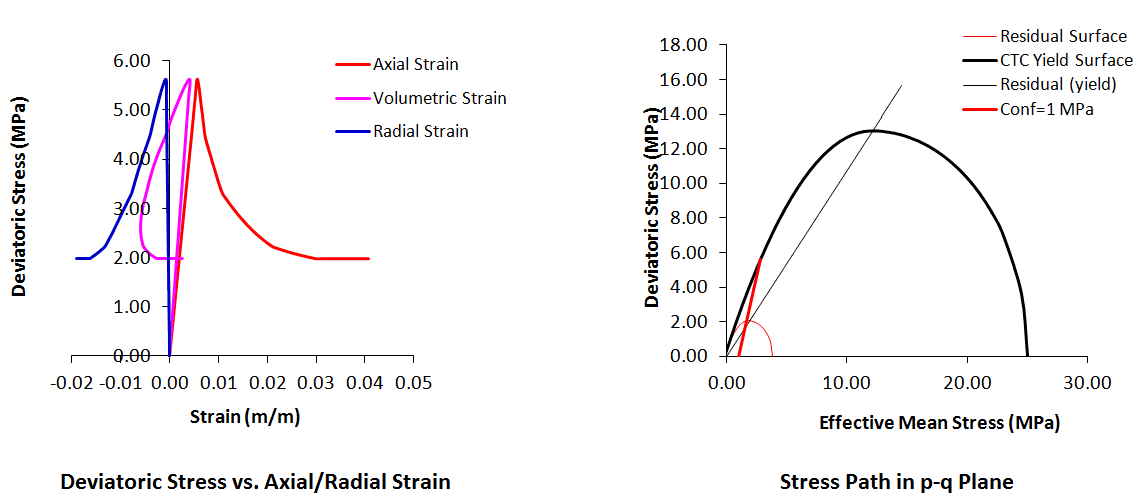
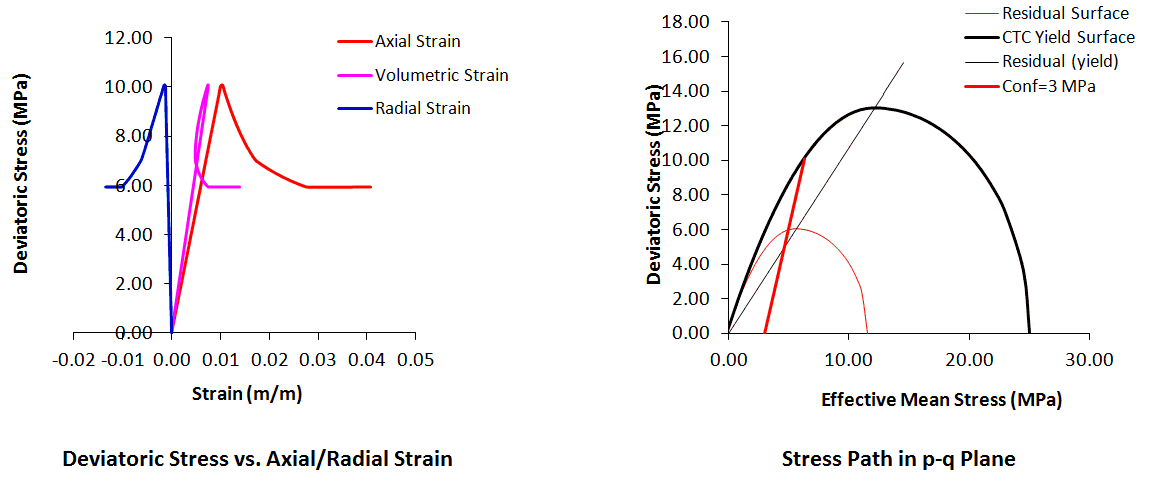
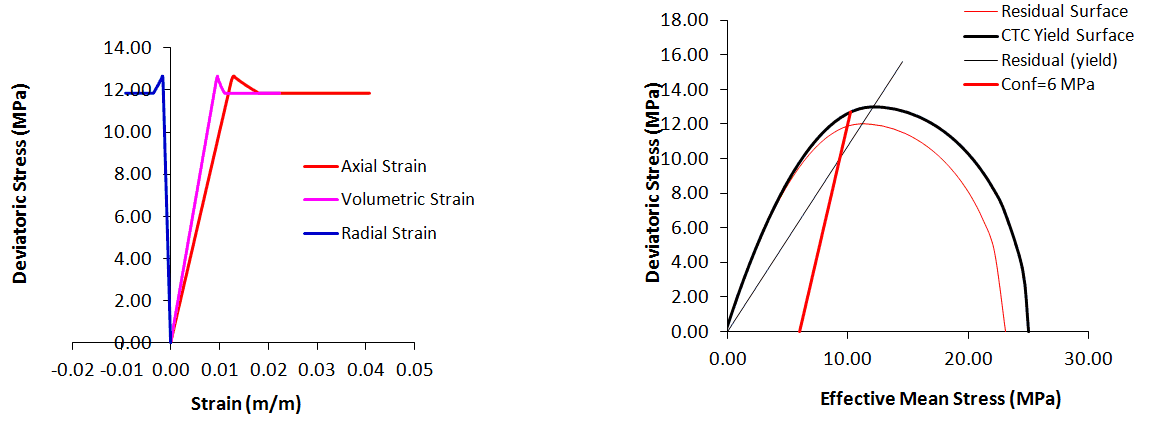
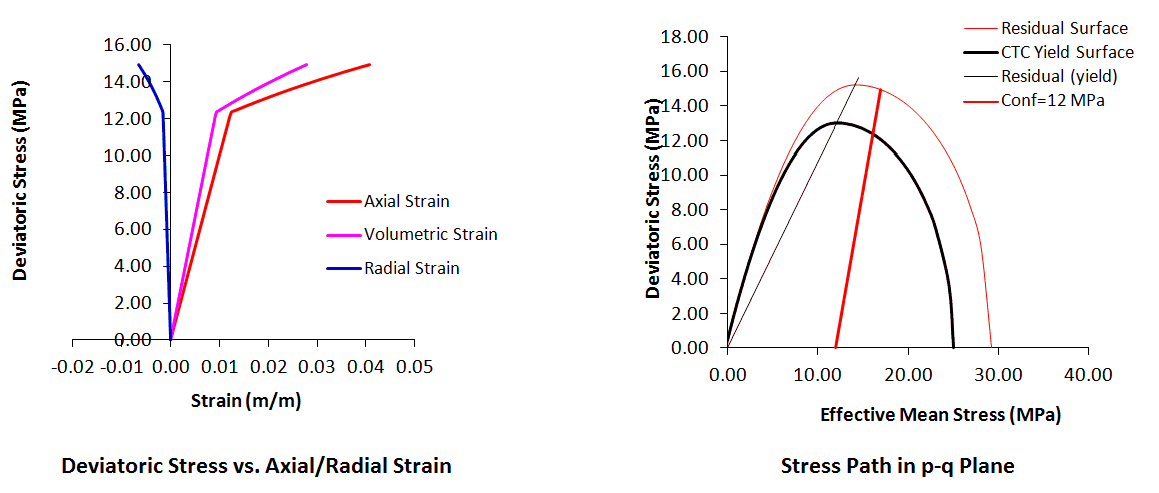
The result files for the project are in directory: mat_001\results. The stress strain data is imported into the Excel file mat_001_Case1.xlsm. The figures show the stress vs. strain curves and the stress paths in the p-q plane together with the initial yield surface (black) and the yield surface in the final configuration (red). It can be seen that: 1 - All cases show an initial elastic response (stress path moving inside the yield surface) followed by plastic yielding (stress path on the yield surface) 2 - Cases with initial consolidation pressure 1 MPa, 3 MPa and 6 MPa show a brittle response (softening after the peak strength is reached can be seen strain vs stress curves) as stress path meets the yield surface on the shear side due to the high over-consolidation state. Eventually the stress path reaches the critical state (increasing strain at constant stress). The residual yield surface is smaller than the initial one. 3 - On the other hand the case with consolidation pressure of 12 MPa shows a ductile response with hardening, as the consolidation pressure is high enough to result in a stress path that meets the yield surface on the cap side. There is hardening and the residual yield surface is larger than the initial one. Critical state is not reached for this case.
1 MPa Confining Stress
3 MPa Confining Stress
6 MPa Confining Stress
12 MPa Confining Stress
Mesh in Initial and Final Configuration
|

