Plot Selection Over Time
Plot Selection Over Time filter allows display of graphs of the evolution of variables for selected cells or points with time. Note that if remeshing has been used the plot may not be representative as the element and nodes ID's may change location on every remesh. To create a Plot Selection Over Time:
1.Perform a cell or node selection. We may use ![]() or
or ![]() for example (see Useful Tools).
for example (see Useful Tools).
2.Click on the ![]() icon from the task bar or Filters/Alphabetical/Plot Selection Over Time.
icon from the task bar or Filters/Alphabetical/Plot Selection Over Time.
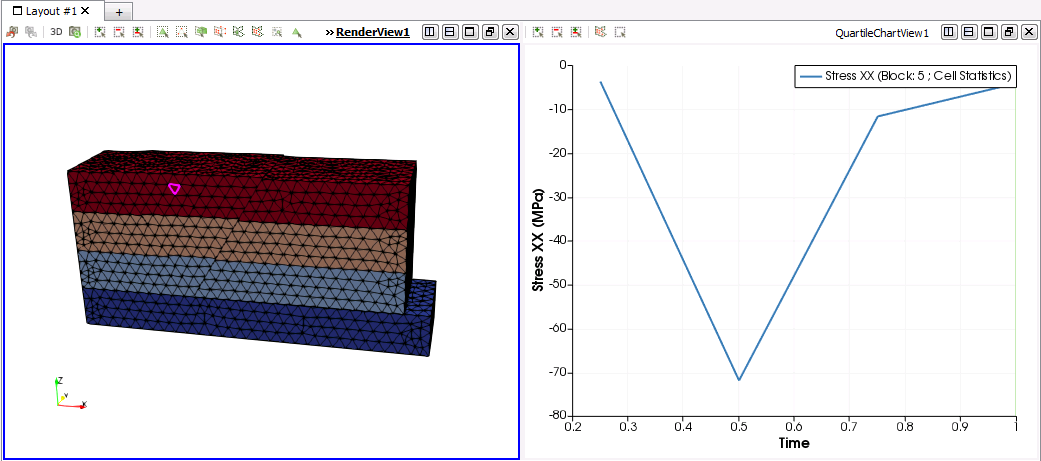
3.Click on ![]() . The display window will be split and a graph with variables as a function of time shown in the new display window.
. The display window will be split and a graph with variables as a function of time shown in the new display window.
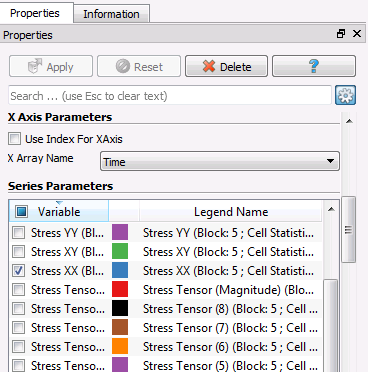
4.In the properties menu select/unselect the variables to be plotted. Note that if multiple cells or nodes are selected statistics on the variables will be calculated instead.
5.The data for all variables (selected and unselected) may be exported into a .CSV file. To do that select the Plot Selection Over Time dataset in the Pipeline Browser and click on either File/Save Data... or click on the ![]() icon from the task bar.
icon from the task bar.

Plot Selection Over Time properties menu

Display Window after Plot Selection Over Time filter aplication
