Case4 Usage of Spatial table (property dependencies)
The data files for the project are in directory: SpatVar_001\Exercises\Case 4\Data. Look for ! TODO text in the datafile and follow the instructions.
In this exercise the Grid from Case 1 will be used to initialize porosity and Poisson's ratio distributions. A spatial_table will then be used to define Young's modulus with those two dependencies. To perform this exercise modify the data as shown bellow. Grid and spatial table data can be copied from excel sheet Case4 in file "SpatVar_001_case4.xlsx".
Include
Data File |
|
* Include ! --------------------------------- Filename "porosity_SpatVar_001_case4.spat"
|
1The included file name should point to the edited .spat file (ending with suffix _case4).
|
Spatial_grid
Data File |
|
* Spatial_grid NUM=1 ! ---------------------------------------- Name "Porosity_Spatial" Type "Grid1" Num_cells_x 10 Num_cells_y 4 Num_cells_z 8 Cell_division_X 800 Cell_division_Y 1000 Cell_division_Z 500 Grid_origin IDM=3 0.0 0.0 0.0 Nodal_variables IDM=3 "Porosity" "P_strnv" "Poiss" Point_values IDM=3 JDM=495 0.05 -0.553652881 0.35 0.049 -0.554013553 0.35 . . . 0.390672 -0.159889195 0.35
|
1The grid definition is identical to case 1 except that Poisson's ratio values are also input. 2Grid point_values can be copied from Case4 sheet in "SpatVar_001.xlsx" file. 3Poisson's ratio is set to 0.35 except for the "high porosity layer" near the base which is set to 0.22. |
Spatial_table
Data File |
|
* Spatial_table NUM=1 ! --------------------------------- Material_names IDM=1 "Shale_CF75" Variable_name "Young" Dependent_variables IDM=2 "Porosity" "Poiss" Dependent_grids IDM=2 "Porosity_Spatial" "Porosity_Spatial" Table_size IDM=2 10 2 Table_values IDM=3 JDM=20 1.00E+05 0.00 0.25 1.00E+05 0.05 0.25 1.00E+05 0.10 0.25 1.00E+05 0.15 0.25 1.00E+05 0.20 0.25 1.00E+05 0.25 0.25 1.00E+05 0.30 0.25 1.00E+05 0.35 0.25 1.00E+05 0.40 0.25 1.00E+05 0.45 0.25 1.00E+04 0.00 0.35 1.00E+04 0.05 0.35 1.00E+04 0.10 0.35 5.00E+03 0.15 0.35 5.00E+03 0.20 0.35 5.00E+03 0.25 0.35 1.00E+03 0.30 0.35 1.00E+03 0.35 0.35 1.00E+03 0.40 0.35 1.00E+03 0.45 0.35
|
1A spatial_table data structure to define Young's modulus as a function of both, porosity and Poisson's ratio is defined. 2Material_names is optional and can be used to apply the spatial table dependencies only to specified materials. If not specified the spatial table dependencies are applied to all materials. Here Material "Shale_CF75" is specified. 3In Variable_name the variable which are assigned values as a function of dependencies is specified. Here "Young" is selected. 4The dependencies are specified in a list in Dependent_variables. Here "Porosity" and "Poiss" are selected. 5In Dependent_grids the grids from which each dependency values are obtained are listed. Both "Porosity" and "Poiss" are obtained from the grid "Porosity_Spatial". If any dependency is not specified via a grid it must be set as "Internal". 6In Table_size the number of different values for each dependency variables to be input in the table must be defined. In this example 10 different values of Porosity and 2 different values of Poisson's ratio will be used to define the spatial table. 7In Table_values the spatial table is defined. The number of columns must be equal to the number of dependent variables + 1. The number of rows must be equal to the total table size (in this example 10x2=20). First column is for the spatial variable (Young's Modulus) and subsequent columns are for dependencies in the same order specified in Dependent_variables. Values for each dependency must be provided in ascending order. For an hipotetical Table_size of (3, 2) the table would be specified as follows: E1 Ø1 υ1 E2 Ø2 υ1 E3 Ø3 υ1 E4 Ø1 υ2 E5 Ø2 υ2 E6 Ø3 υ2 Where En, Øn and υn are the "n-th" values of Young's modulus, Porosity and Poisson's ratio respectively. |
Results
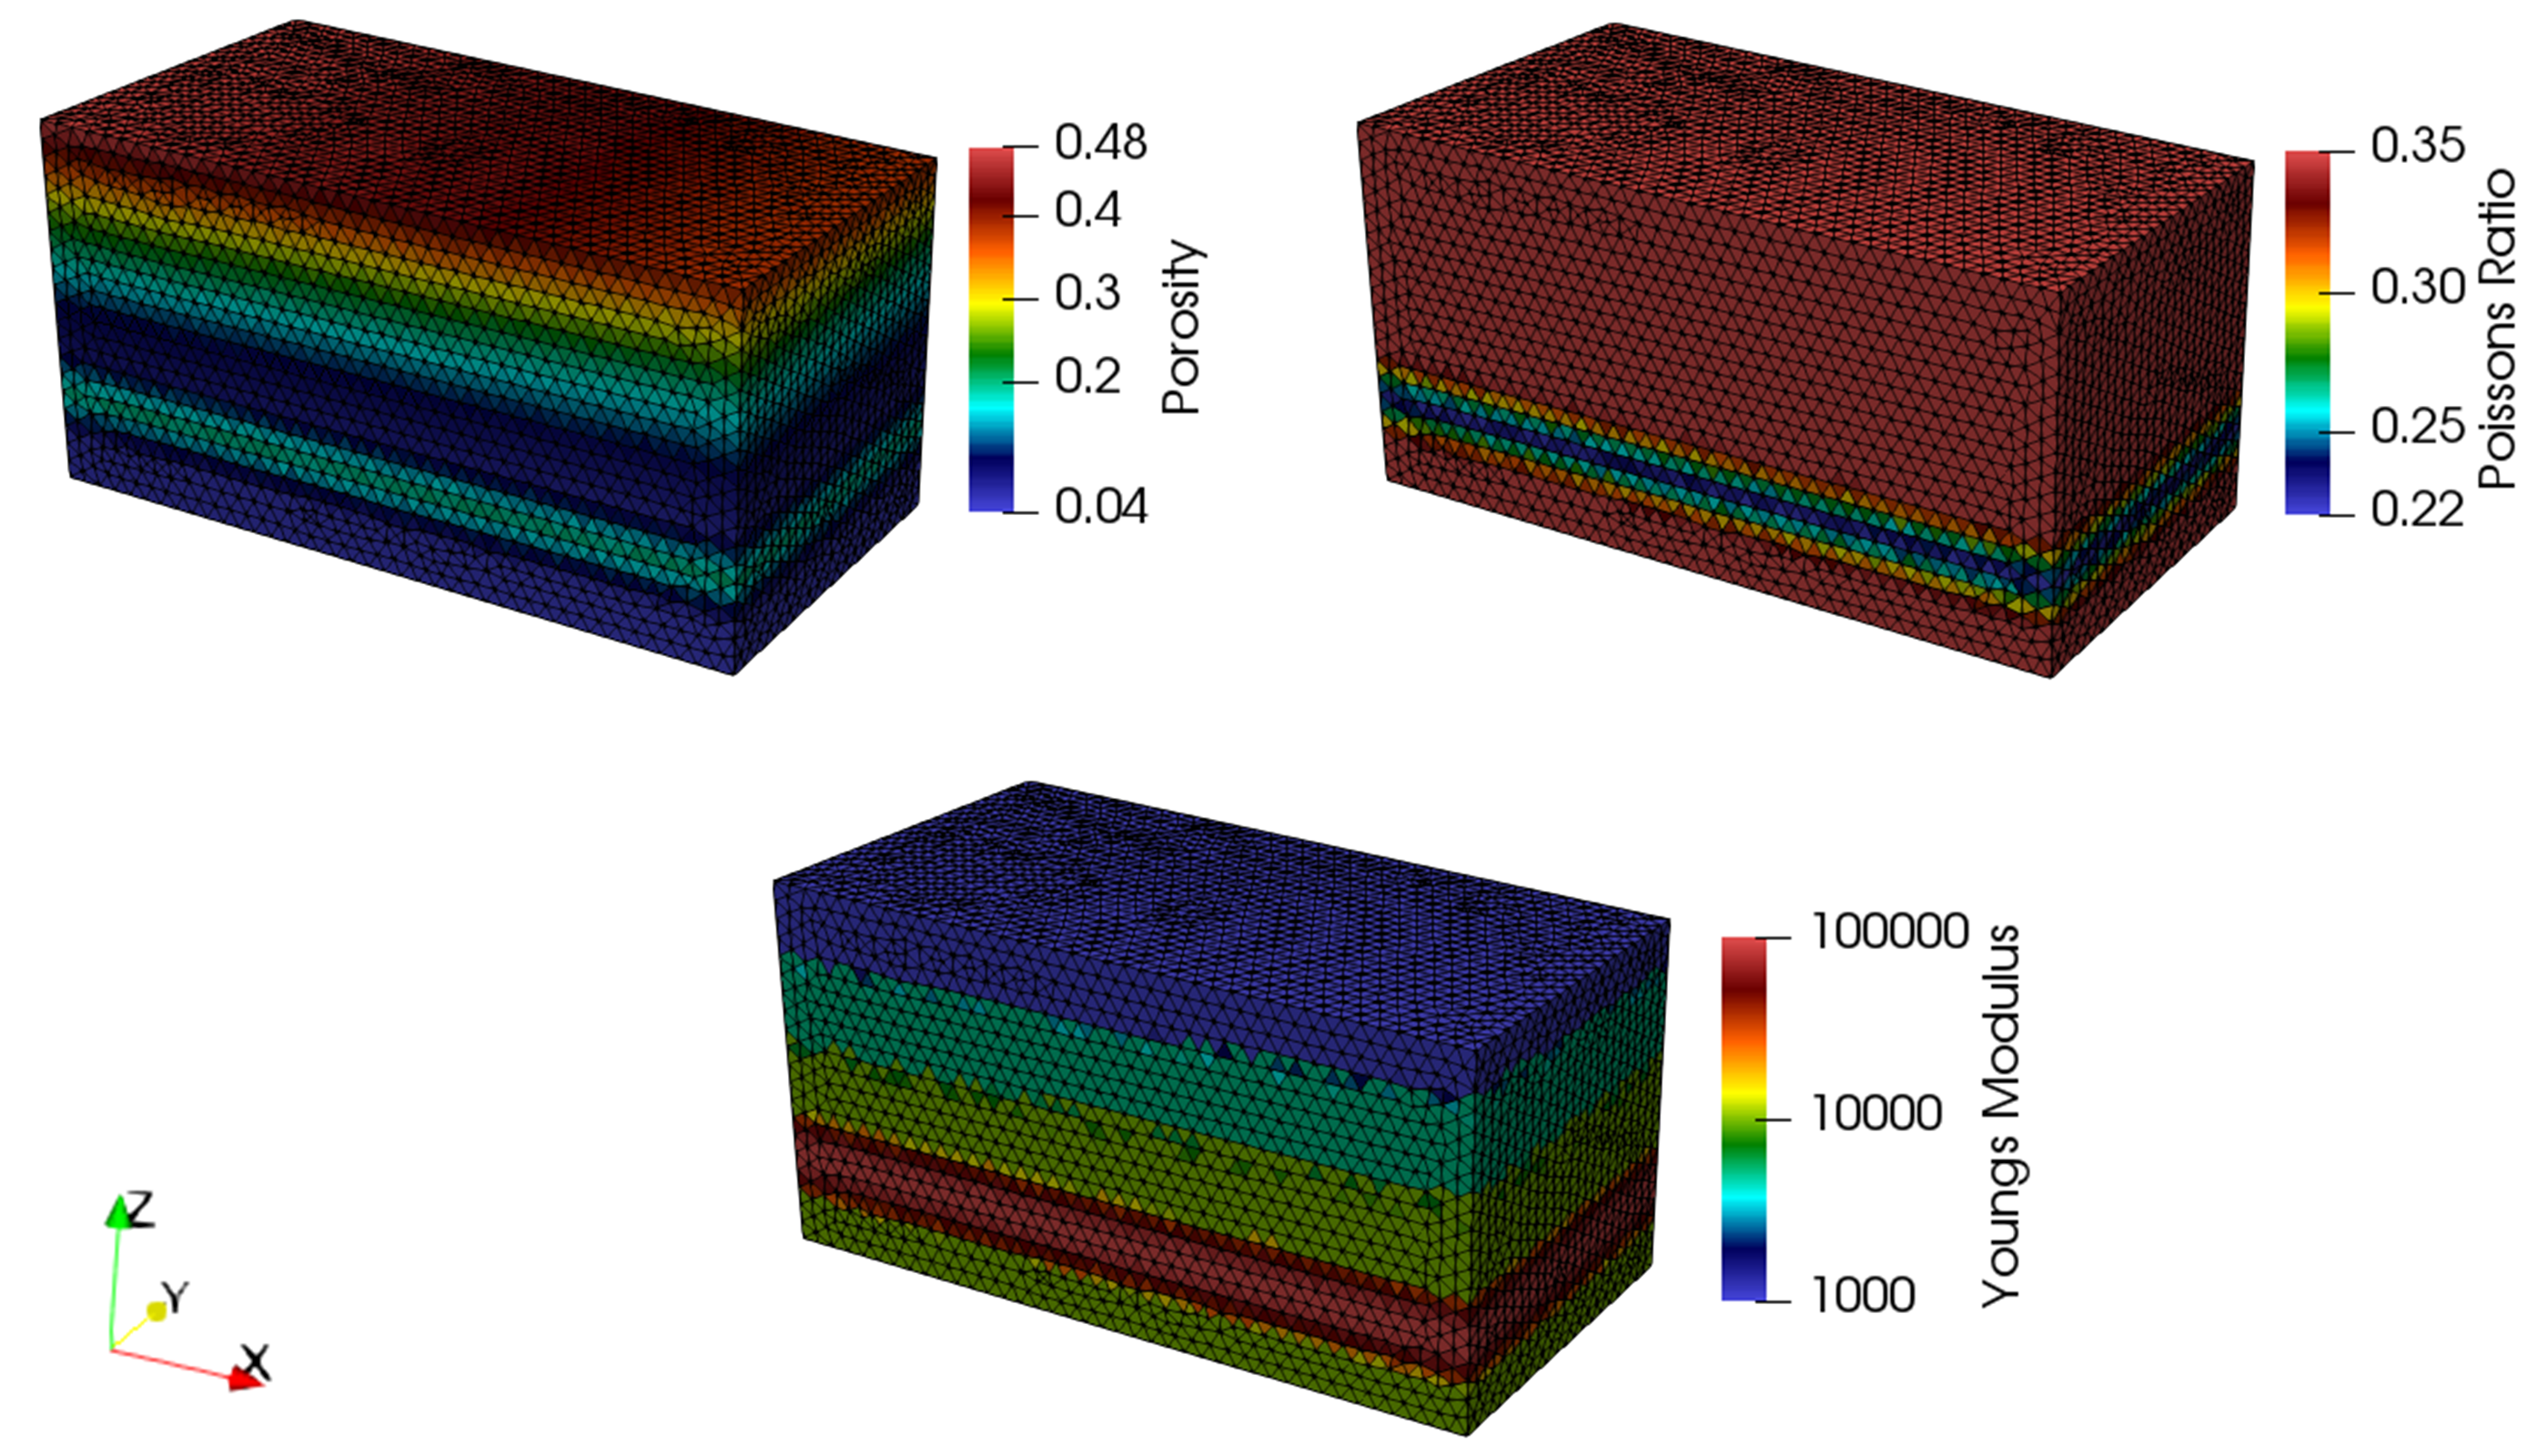
The result files for the project are in directory: SpatVar_001\Case4\Results. From the results it can be noted how Young's Modulus has variations in its values according to Porosity and Poisson Ratio (note the high Young modulus values for the high porosity - low Poisson's ratio "layer" near the base of the model).
Defined spatial grid values for porosity and Poisson's ratio (top). Young's modulus values from spatial table (bottom).
|

