Val_006 Well Geothermal - U-Shaped Closed-Loop Well System
Overview
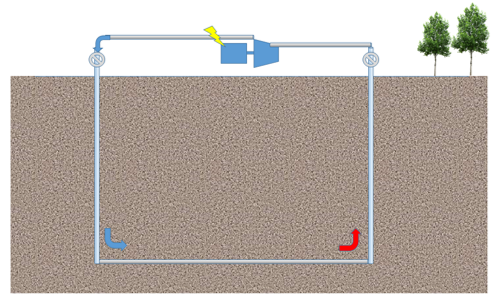
In this heat transfer example, wellbore heat transmission in injection and production wells and the surrounding rock will be simulated in ParaGeo using a closed-loop well system and benchmarked against the Stanford geothermal closed-loop calculator pangea.stanford.edu/ERE/db/Roland/ClosedLoop/index.php [ref 1] which is based on the Ramey equation [ref 2]. A direct comparison of results will also be made with the ParaGeo-Ramey [ref 2] and Hasan models [ref 3].
Note that in ParaGeo the Ramey and Hasan models are applicable only to "casing" or "shut" well status, i.e. no leak-off.
|
Problem Description
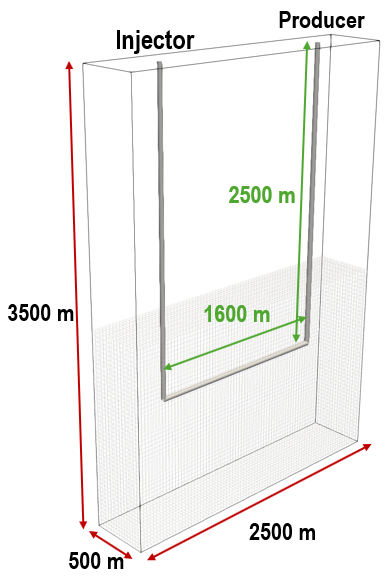
The simulation example comprises a U-shaped injector and producer well system (L1600m x D2500m) in a rock model domain with dimensions L2500m X W500m x D3500m as shown below. To optimize modelling of heat transfer between the rock domain and well, similar sized elements are used for the rock and well. The rock is discretised using 128,000 hexahedral elements with element size c.a. 33m and the well elements using 133 points with element size of 50m. The rock formation is prescribed temperatures of 25°C at the top and 156.25°C at the base of the model, i.e. geothermal gradient of 0.0375°C/m. Fluid at 15°C is injected into the well of radius 0.15m at a rate of 0.03m3/s (equivalent to 30kg/s).
Other key model parameters are shown in the table below:
|
||||||||||||||||||||||||||||||||||||
Simulation
The data files for the example are in folder: ParaGeo Examples\Validation\Val_006\Data: •Val_006a.dat - Ramey model •Val_006b.dat - Hasan model (only change in data file is "Model_1" setting for Radial_heat_model keyword in Well_definition data structure set to "Model_2".
Note that the model time unit in this example is defined in "seconds", thus the thermal units and thermal input data can be defined as W/m/K for the conductivity and J/kg/K for the specific heat capacity. If other model time units are used, the thermal input data must be manually scaled to the model time units defined for the example (refer Ex_007 Case01). Parageo does not automatically scale the thermal units to the model time units.
The simulation is performed in two stages: Stage 1: Initialize temperature in the rock with surface temperature of 25 °C and base temperature of 156.25 °C, i.e. thermal gradient of 0.0375 °C/m. oThe initial rock temperature must be established prior to activation of the well elements since the well elements will adopt the surrounding rock temperature as its initial temperature.
Stage 2: Define well element data and perform heat transfer between rock and injected well fluid over 3000 days (i.e. 2.59E8 seconds) of injection and production.
Well Data
|
Results
The results files for the example are in folder: ParaGeo Examples\Validation\Val_006\Results.
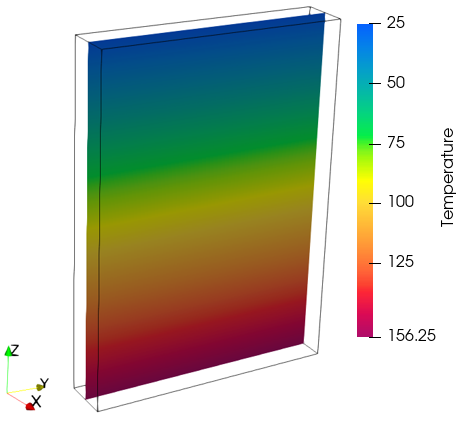
The initial temperature distribution in the rock domain with surface temperature of 25 °C and base temperature of 156.25 °C, as shown in the plot below, serves as the background initial temperature in the well.
Initial temperature distribution in rock domain (mid-slice plot in X-X)
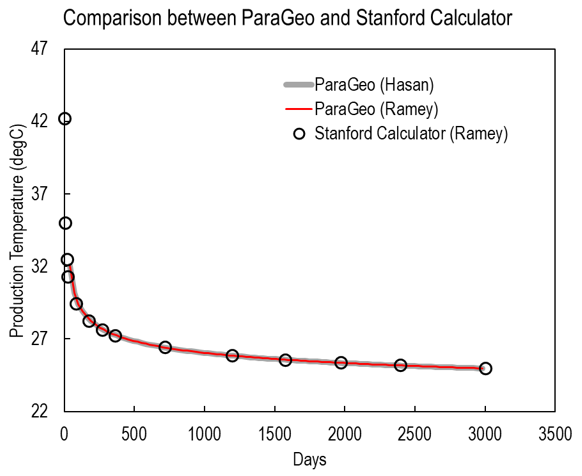
The graphical production temperature vs time plot below shows the results of ParaGeo using both the Ramey model and Hasan model compared (benchmarked) against the Stanford calculator (which utilizes the Ramey equation). The ParaGeo-Ramey and Hasan models are almost identical and these show very good correlation with the Stanford calculator results.
Comparison plot between ParaGeo and Stanford Calculator
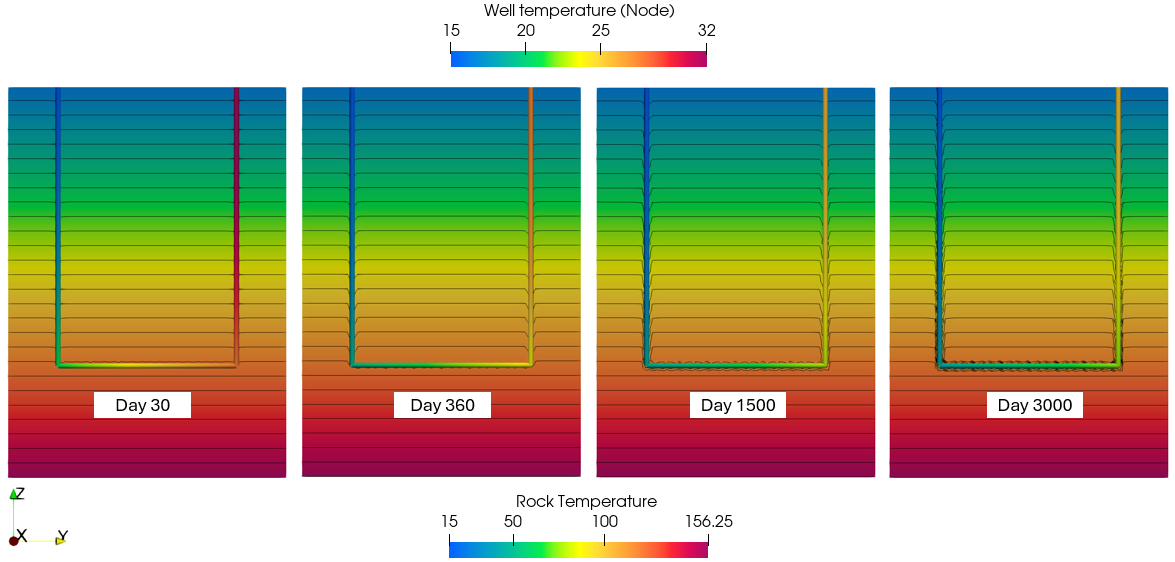
As the ParaGeo-Ramey and Hasan results are almost identical, only the ParaGeo-Ramey contour plot results are shown. The mid-slice X-X plots below, overlaid with the isosurface temperature contours, show the evolution of temperature distribution in the rock and well over the 3000 days of injection/production. Observed around the well, the isothermal contours curve downwards, indicating that the well functions as a heat sink. These downward curvatures are more pronounced at greater depths due to the increased temperature gradient between the well fluid and the rock formation.
Evolution of temperature distribution (overlaid with isosurface contours) in the rock and well over 3000 days of injection/production (mid-slice plot in X-X) |
References
[1] pangea.stanford.edu/ERE/db/Roland/ClosedLoop/index.php. [2] Ramey, H.J. Jr., 1962. Wellbore Heat Transmission. SPE, 96. [3] Hasan, A.R. and Kabir, S., 2012. Wellbore heat-transfer modeling and applications. Journal of Petroleum Science and Engineering.
|

