Case02 Contact tangential permeability as a function of stress
The initial data file for the project is: Cont_002\Case02\Data\Cont_002_Case02.dat.
The basic datafile definition is very similar to that of Cont_002_Case01. Note however that some changes in the top surface stress load curve and longer simulation time have been introduced in order to facilitate observation of the effect of contact stress in contact tangential conductivity. In this case the contact property is defined such that the contact tangential flow conductivity is defined as a function of the contact normal stress so that high stresses lead to permeability reduction. This model allows to simulate fault closure with stress.
For more information about contact mechanics see Overview of Contact in ParaGeo and for contact data definition see Contact Data.
Contact_property
Data File |
|
* Contact_property NUM=1 ! ---------------------------------------- Name "Sand_contact" Compression_model 1 Compression_properties IDM=1 /Normal Penalty/ 5000 Tangential_model 2 Tangential_properties IDM=2 /Tangential Penalty/ 10 /Friction coefficient/ 0.1 Flow_model_normal 11 Flow_properties_normal IDM=2 /Penalty Perm./ 1E-23 /Filt. Cake Perm.)/ 1E-23 Flow_model_tangential 12 Flow_tangential_table IDM=7 JDM=2 /Cont. Stress/ 0.0 9.0 ... 18.0 /Permeability./ 1E-13 1E-13 ... 1E-36 Thermal_model_normal 1 Thermal_properties_normal IDM=2 /Therm. Cond. (Penalty)/ 12.6144E+13 /Therm. Cond. (Filter Cake)/ 12.6144E+13 Contact_width 0.001
|
1The Flow_model_tangential is set to 12 (permeability as a function of stress). 2The flow tangential model requires definition of Flow_tangential_table. In there the tangential contactpermeability is defined to decrease as a function of stress in a tabular form. The chosen values have been arbitrarily selected in order to demonstrate the behaviour of this model.
|
| Results |
The results for the project are in: Cont_002\Case02\Results.
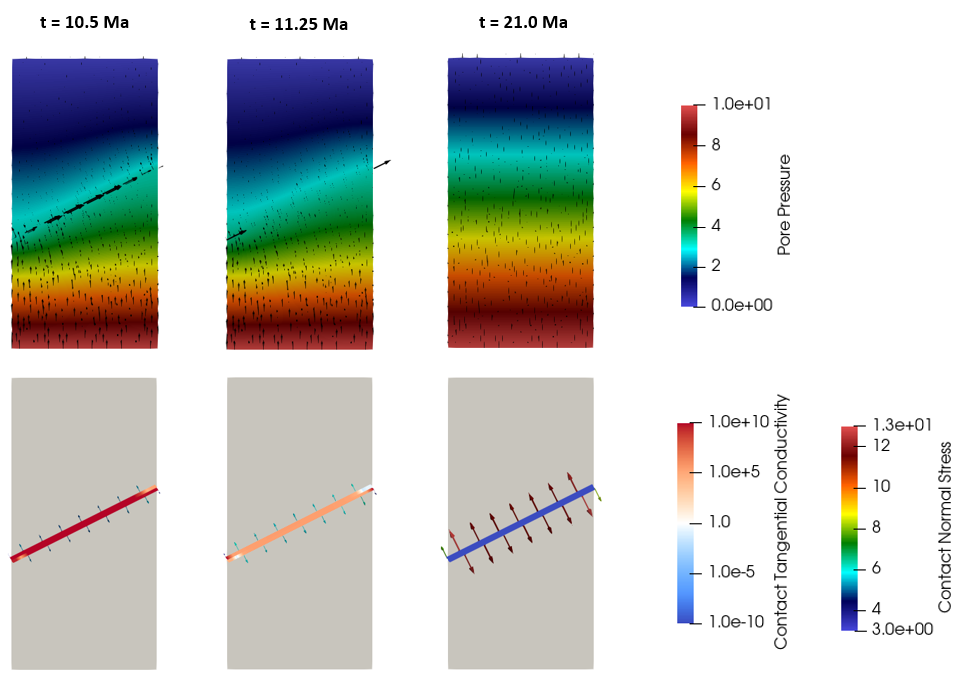
The top surface stress load was modified so that there is an additional stress increase from time t=10 Ma to t=15 Ma. In the results below it can be seen that until time ~ t=10.5 Ma there has been a preferential flow pathway along the fault because the relatively low stress resulted in high tangential flow conductivity. Note the tilted pore pressure contours as a result of such flow pathway. At t=12.25 Ma in can be seen that the increase of stress on the fault resulted in a decrease of the fault tangential conductivity of several orders of magnitude. At t=21 Ma it can be seen that due to the high stresses in the fault the fault tangential conductivity is substantially low. The time since closure of the preferential flow pathway has been enough to result in horizontal pore pressure contours.
Pore pressure contours with flow vectors (top). Fault tangential conductivity with fault normal stress vectors (bottom).
|

