Case03 Contact tangential permeability as a function of depth
The initial data file for the project is: Cont_002\Case03\Data\Cont_002_Case03.dat.
The basic datafile definition is very similar to the previous cases. In this case the contact tangential permeability is defined as a function of depth. Hence minimal stratigraphy data identifying top surface need to be included. Note that in this case fault angle has been increased so that the fault has depths ranging from 500 m to 3500 m thus facilitating demonstration of model usage.
For more information about contact mechanics see Overview of Contact in ParaGeo and for contact data definition see Contact Data.
Contact_property
Data File |
|
* Contact_property NUM=1 ! ---------------------------------------- Name "Sand_contact" Compression_model 1 Compression_properties IDM=1 /Normal Penalty/ 5000 Tangential_model 2 Tangential_properties IDM=2 /Tangential Penalty/ 10 /Friction coefficient/ 0.1 Flow_model_normal 11 Flow_properties_normal IDM=2 /Penalty Perm./ 1E-20 /Filt. Cake Perm.)/ 1E-23 Flow_model_tangential 13 Flow_tangential_table IDM=4 JDM=2 /Depth/ 0.0 2000 2001 40000 /Permeability./ 1E-32 1E-32 1E-12 1E-12 Thermal_model_normal 1 Thermal_properties_normal IDM=2 /Therm. Cond. (Penalty)/ 12.6144E+13 /Therm. Cond. (Filter Cake)/ 12.6144E+13 Contact_width 0.001
|
1The Flow_model_tangential is set to 13 (fluid conductivity as a function of depth). 2The flow tangential model requires definition of Flow_tangential_table. In there the contact permeability is defined as a function of depth in a tabular form. The chosen values have been arbitrarily selected so that the deepest half of the fault is highly conductive whereas the shallowest half of the fault is non-conductive. Thus this conductivity distribution is expected to have a large influence on pore pressure contours.
|
Stratigraphy data
Data File |
|
* Stratigraphy_definition ! --------------------------------- Top_surface_horizon "Top"
* Stratigraphy_horizon NUM=1 ! --------------------------------- Name "Top_surface" Geometry_set "Top"
|
1Minimal stratigraphy data to identify the top surface is required in order to allow depth dependent data.
|
| Results |
The results for the project are in: Cont_002\Case03\Results.
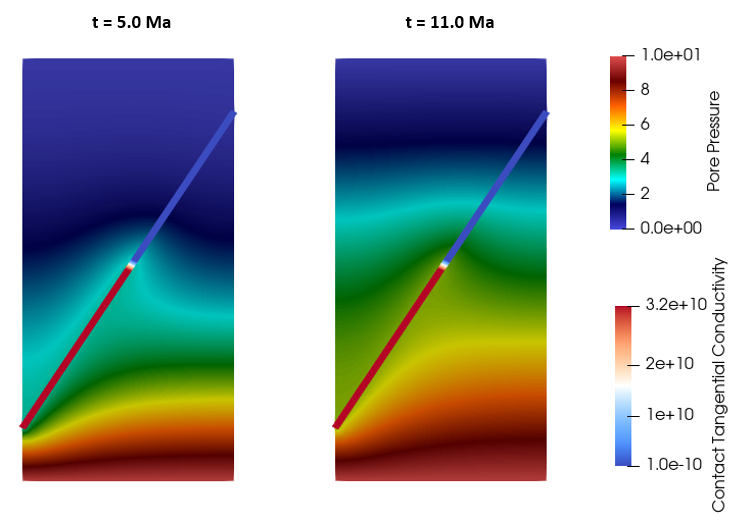
In the results below it can be seen that the pore pressure contours indicate that the high conductivity of the deepest part of the fault facilitated rapid transfer of pore pressure to the fault mid depth.
Pore pressure contours and fault tangential conductivity at two simulation times
|

