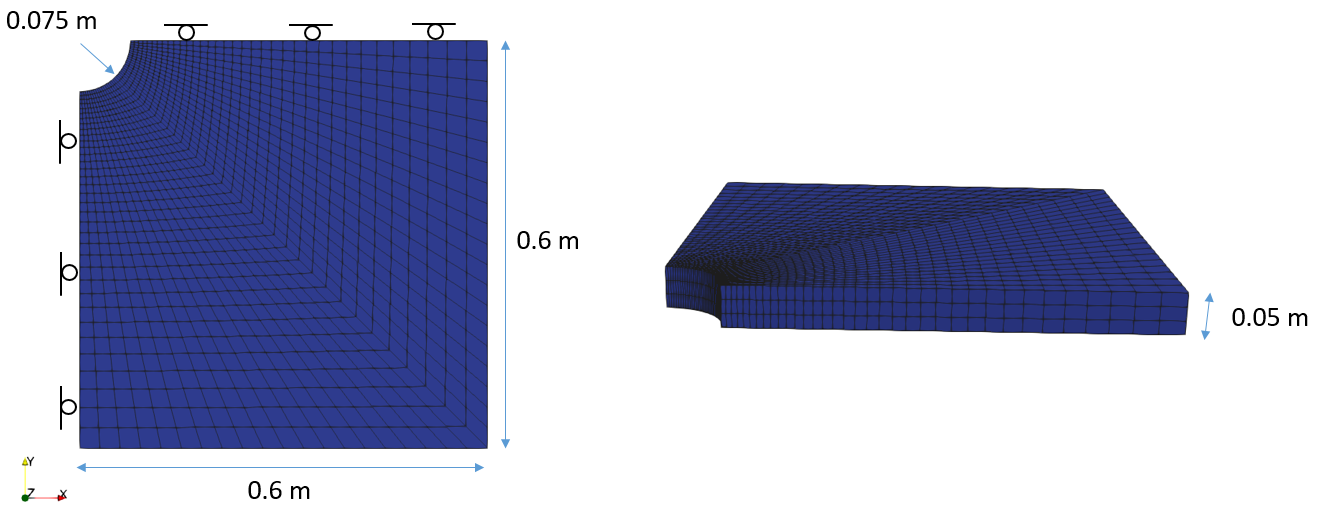
In this example a 3D coupled open-hole (no casing) wellbore model will be modelled. This type of model can be used to analyse wellbore stability during drilling and calculate admissible mud pressures. The model geometry considers a quarter symmetry (normal displacements constrained in the symmetry boundaries). The dimensions are indicated in the figure below. The domain is discretized into 4200 hexahedral elements.

View of the wellbore model geometry
The simulation comprises two stages:
1.Initialization in a single step:
a.Application of an initial geostatic stress of σx' = σy' = 1·107 Pa and σz' = 2 · 107 Pa and an initial pore pressure of p=1.5·107 Pa.
b.Apply a pore pressure to the exterior side boundaries and in the inner wellbore surface of p=1.5·107 Pa.
c.Fix the X and Y displacements in the inner wellbore wall
d.Fix the displacements in the perpendicular direction for symmetry boundary surfaces
e.Fix vertical displacements for base surface and apply a stress boundary condition of σz' = 3.5 · 107 Pa
f.Apply stress boundary conditions of σx = σy = 2.5·107 Pa to external boundaries perpendicular to X and Y axes respectively

Schematic of boundary conditions during initialization phase
2.Drilling phase:
a.Fixity in the inner wellbore wall is removed. The stress on the wellbore wall calculated on the previous stage is gradually ramped down to zero by using the Constraint_relaxation data structure.
b.Mud load is applied to the wellbore wall by:
i.Increase of the inner pore pressure from p=1.5·107 Pa to p=2.0·107 Pa.
ii.Apply a the mud surface stress load of σmud=2.0·107 Pa.
iii.Note that both loads correspond to the flow field and mechanical field load of the applied mud respectively.

Schematic of boundary conditions during drilling phase
The formation material is considered poro-elasto-plastic the properties of which are summarized in the table below. Note that the material is defined using the same properties as Mat_001_Case3 tutorial example.
|
Formation
|
Grain Stiffness, Kg
|
30 GPa
|
Grain density, ρg
|
2710 Kg/m3
|
Porosity
|
0.35
|
Young's Modulus, E
|
Stress dependent
|
Poisson's Ratio, υ
|
0.25
|
Reference Bulk Modulus (K0)
|
6·108 Pa
|
Unloading modulus, κ
|
0.01
|
Reference pt
|
0.8·106 Pa
|
Reference pc
|
-53·106 Pa
|
Friction parameter
|
63.0º
|
Dilation parameter
|
66.0º
|
Beta0 (deviatoric plane)
|
0.6
|
Beta1 (deviatoric plane)
|
1.0
|
Alpha (deviatoric plane)
|
0.25
|
Exponent n (Yield)
|
2.2
|
Exponent m (Flow potential)
|
1.2
|
Hardening parameter, λ
|
0.09
|
Permeability, k
|
2.0·10-17 m2
|
Biot Constant, α
|
1.0
|
Water properties are summarized in the following table:
|
Water
|
Stiffness, Kw
|
2 GPa
|
Density, ρw
|
1040 kg/m3
|
Viscosity, μw
|
1.157·10-8 Pa· day
|
This example aims to be a reference for:
•Coupled wellbore model benchmark
•Usage of Constraint_relaxation
The data files for the examples is found in: ParaGeo Examples\General Examples\Ex_004\Data
| Key data for initialization stage |
Geostatic_data
Data File
|
|
* Geostatic_data NUM=1
Name "InitialStress"
Groups IDM=1
"Formation"
Initial_stress IDM=3
-1e7 -1e7 -2e7
Pore_pressure_distribution "Constant"
Pore_pressure 1.5e7
|
1.In first stage Geostatic_data is specified. This data is used to define the initial stress state and the initial pore pressure for group "Formation"
|
Support_data
Data File
|
|
* Support_data
Displacement_codes IDM=3 JDM=4
1 0 0
0 1 0
0 0 1
1 1 0
Displacement_code_geom_set IDM=4
"Symmetry_X"
"Symmetry_Y"
"Base"
"Wellbore_wall"
Displacement_code_geom_ass IDM=4
1 2 3 4
Pore_pressure_codes IDM=1 JDM=2
1
0
Pore_pressure_code_geom_set IDM=3
"Ext_X"
"Ext_Y"
"Wellbore_wall"
Pore_pressure_code_geom_ass IDM=3
1 1 1
|
1.Displacements in their respective normal directions are constrained for symmetry boundaries and model base. 2.Displacements in X and Y directions are constrained for the wellbore wall 3.Pore pressure is prescribed in the exterior boundaries and in the wellbore wall
|
Loading data
Data File
|
|
* Global_loads NUM=1
Name "Stress_XYSides"
Surface_load IDM=3 JDM=1
1 0 0
Surface_load_geom_set IDM=2
"Ext_X"
"Ext_Y"
Surface_load_geom_ass IDM=2
1 1
* Time_curve_data NUM=1
Name "Stress_XYSides"
Curve_type 1
Time_curve IDM=2
0.0 1
Load_factor IDM=2
2.5e7 2.5e7
* Global_loads NUM=2
Name "Stress_ZSides"
Surface_load IDM=3 JDM=1
1 0 0
Surface_load_geom_set IDM=1
"Top"
Surface_load_geom_ass IDM=1
1
* Time_curve_data NUM=2
Name "Stress_ZSides"
Curve_type 1
Time_curve IDM=2
0.0 1
Load_factor IDM=2
3.5e7 3.5e7
* Global_loads NUM=3
Name "Pp_wellbore"
Prescribed_pore_pressure IDM=1 JDM=1
1
Pres_pore_pressure_geom_set IDM=1
"Wellbore_wall"
Pres_pore_pressure_geom_ass IDM=1
1
* Time_curve_data NUM=3
Name "Pp_wellbore"
Curve_type 1
Time_curve IDM=2
0.0 1
Load_factor IDM=2
1.5e7 1.5e7
* Global_loads NUM=4
Name "Pp_Boundaries"
Prescribed_pore_pressure IDM=1 JDM=1
1
Pres_pore_pressure_geom_set IDM=2
"Ext_X"
"Ext_Y"
Pres_pore_pressure_geom_ass IDM=2
1 1
* Time_curve_data NUM=4
Name "Pp_Boundaries"
Curve_type 1
Time_curve IDM=2
0.0 1
Load_factor IDM=2
1.5e7 1.5e7
|
1.Stress boundary conditions are applied to the top and external side boundaries. Note that loads are specified in local element coordinates so that positive values indicate stress pointing towards inside the element whereas negative values indicate stress pointing outwards. Note also that as the loads are in total stress the values are calculated as the initial stress + the initial pore pressure (for example prescribed σx in the external boundary perpendicular to X axis is calculated as σx= 1.0·107 + 1.5·107 = 2.5·107 Pa). 2.Pore pressure equal to the initial value is prescribed to the external boundaries and on the wellbore wall.
|
Couple freedoms
Data File
|
|
* Couple_freedoms NUM=1
Geomechanical_codes IDM=3
1 0 0
Geometry_sets IDM=1
"Ext_X"
* Couple_freedoms NUM=2
Geomechanical_codes IDM=3
0 1 0
Geometry_sets IDM=1
"Ext_Y"
* Couple_freedoms NUM=3
Geomechanical_codes IDM=3
0 0 1
Geometry_sets IDM=1
"Top"
|
1.Couple freedoms data is defined for the Top and external boundaries to make sure all nodes have consistent displacements in the direction normal to the respective surfaces.
|
|
| Key data for drilling stage |
Support_data
Data File
|
|
* Support_data
Displacement_codes IDM=3 JDM=4
1 0 0
0 1 0
0 0 1
1 1 0
Displacement_code_geom_set IDM=3
"Symmetry_X"
"Symmetry_Y"
"Base"
Displacement_code_geom_ass IDM=3
1 2 3
Pore_pressure_codes IDM=1 JDM=2
1
0
Pore_pressure_code_geom_set IDM=3
"Ext_X"
"Ext_Y"
"Wellbore_wall"
Pore_pressure_code_geom_ass IDM=3
1 1 1
|
1.Support_data is overwritten and the only difference compared to stage 1 is that displacements in the wellbore wall are no longer constrained.
|
Constraint_relaxation
Data File
|
|
* Constraint_relaxation
Displacement_geom_set IDM=1
"Wellbore_wall"
|
1.The Constraint_relaxation data structure is applied to the wellbore wall. Thus the stress calculated during the previous stage due to the reaction of the fixity conditions is initially applied and gradually ramped down over the stage.
|
Loading data
Data File
|
|
* Time_curve_data NUM=3
Name "Pp_wellbore"
Curve_type 1
Time_curve IDM=2
0.01 1.01
Load_factor IDM=2
1.5e7 2.0e7
* Global_loads NUM=5
Name "Mud_Stress"
Surface_load IDM=3 JDM=1
1 0 0
Surface_load_geom_set IDM=1
"Wellbore_wall"
Surface_load_geom_ass IDM=1
1 1
* Time_curve_data NUM=5
Name "Mud_Pressure"
Curve_type 2
Time_curve IDM=2
0.01 1.01
Load_factor IDM=2
0 2.0e7
|
1.Time_curve NUM=3 is overwritten so that Pore pressure in the wellbore wall increases from 1.5·107 Pa to 2.0·107 Pa due to the application of the drilling mud pressure. 2.Global_loads NUM=5 corresponds to the mechanical load of the drilling mud. As a such it has to have a consistent value with the mud pore pressure.
|
|
The result files for the project are in directory: ParaGeo Examples\General Examples\Ex_004\Results.
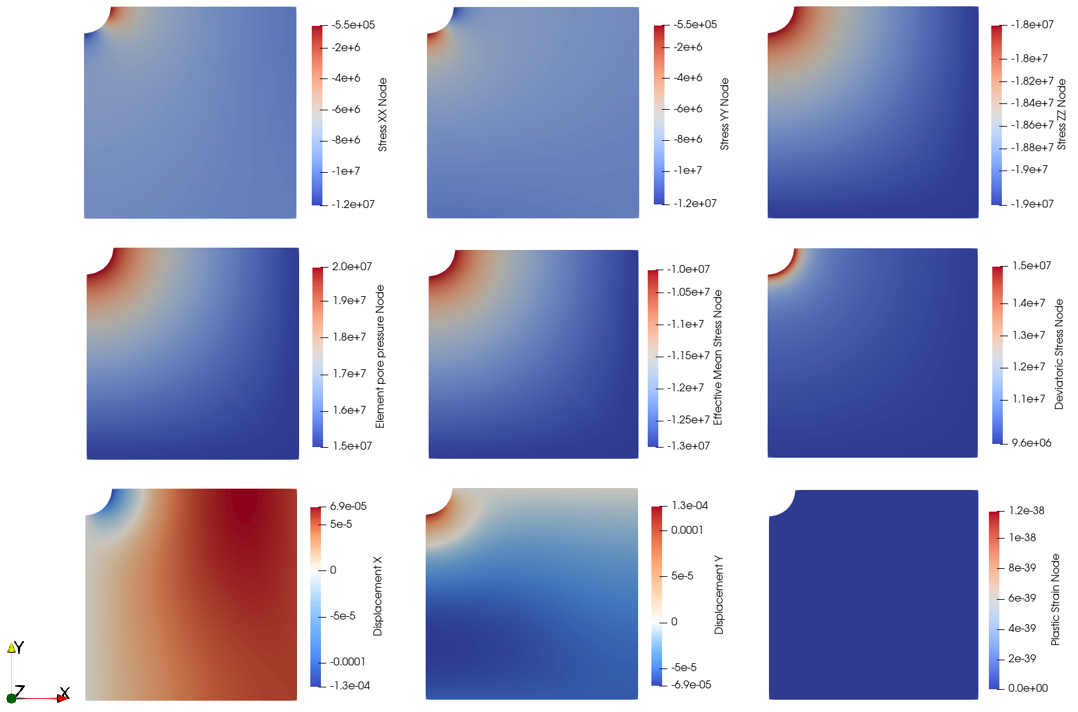
The results show stress concentrations in X and Y directions near the wellbore wall with the maximum magnitudes being tangential to the wellbore wall and minimum magnitudes being perpendicular. Stress in Z direction has its minimal value near the wellbore wall due to the maximum value in pore pressure. It can be seen that the minimum effective mean stress and the maximum deviatoric stress is found near the wellbore wall and hence is the zone more prone to failure. The well has closed a bit due to elastic displacements with a reduction in its radius of c.a. 1/10 of mm.

Stresses, Pore pressure and displacements distributions in the wellbore model
|


