Case01 Confined Compression Test
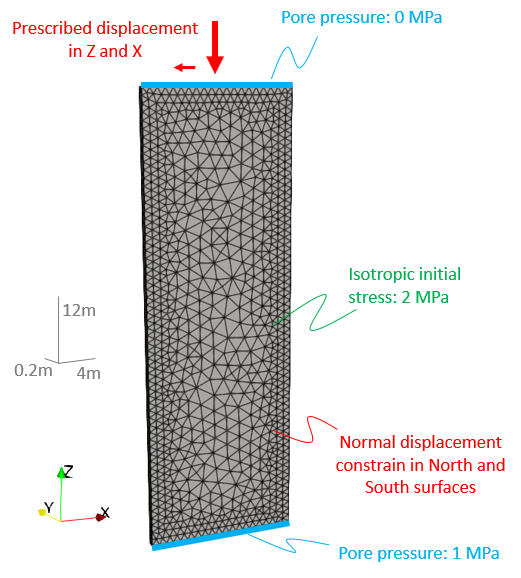
This example considers a confined compression test with prescribed pore pressure at the top (0 MPa) and bottom surfaces (1 MPa) to achieve a transient pore pressure distribution within the domain. The geometry considers a 3D slice with displacement constrains in the "North" and "South" surfaces to simulate the problem in plane strain conditions. Note that the model size (12 m x 4 m x 0.2 m) has been chosen arbitrarily rather than being representative of a lab test sample. The top surface of the model is prescribed a downward and slightly westward displacement in order to facilitate strain localisation in a given direction. The material is over consolidated with an initial pre-consolidation pressure of 25 MPa. The confining pressure applied to the East and West boundaries as well as the initial geostatic stress has been set to 2 MPa and applied instantaneously at the beginning of the simulation. The material has a constant permeability of 1E-12 m2. The following cases will be considered:
1.Case01a: Fault is predicted based on a plastic strain threshold value of 0.1. Fault elements have permeability multiplied by 100.
2.Case01b: Same case as 01a but plastic strain threshold increased to 5.0 to avoid predicting fault elements and allow for comparisons to highlight the effect of the fault in case 01a.
3.Case01c: Fault is seeded using part geometry at a different location than the fault predicted in Case01a. Both perm enhancement and strength reduction are considered.
4.Case01d: Fault is seeded using part geometry at a different location than the fault predicted in Case01a. Only perm enhancement is considered.
|
Initial model, mesh and boundary conditions |
| Common to all cases |
Considering continuum fault flow model requires assignment of the corresponding Fracture_data into the material(s). If no fracture data is assigned to a given material then the continuum fault model will have no effect in such material even if the fault is prescribed.
Material_data
|
| Case01a |
This case considers that fault is predicted based on a plastic strain threshold value of 0.1. Permeability is enhanced using a multiplication factor of 100. The fault properties are defined within Fracture_data data structure.
Fracture_data
|
| Case01b |
The objective of this case is to provide a reference solution without a fault being predicted to allow comparisons with Case01a and hence facilitate understanding of the effects of the continuum fault flow model. Consequently this case is identical to Case01a but with the plastic strain threshold set to a high value (5.0) in order to prevent prediction of any fault element.
Fracture_data
|
Case01c
The present case considers a fault being prescribed in a higher location that the fault predicted in Case01a. Both perm enhancement and strength reduction will be considered thus creating a preferential localisation pathway which different from the one predicted in Case01a. For prescribing a fault the following data structures are required:
•Fracture_data with an assigned Coordinate_system (compulsory) •Fault_set linking the Fracture_data with the Part_geometry_set which defines the fault pathway as well as defining the seeding properties for the fault. •Fault_insertion to request fault seeding (prescribe the fault)at the elements intersecting the part geometry.
Fracture_data
Part geometry
Fault_set
Fault_insertion
|
Case01d
This case is identical to Case01c but without considering strength decrease at the fault. Consequently only the data that has changed is highlighted.
Fault_set
|
| Results |
A selection of result files for the project are provided in directory: ParaGeo Examples\General Examples\Ex_010\Case01\Results.
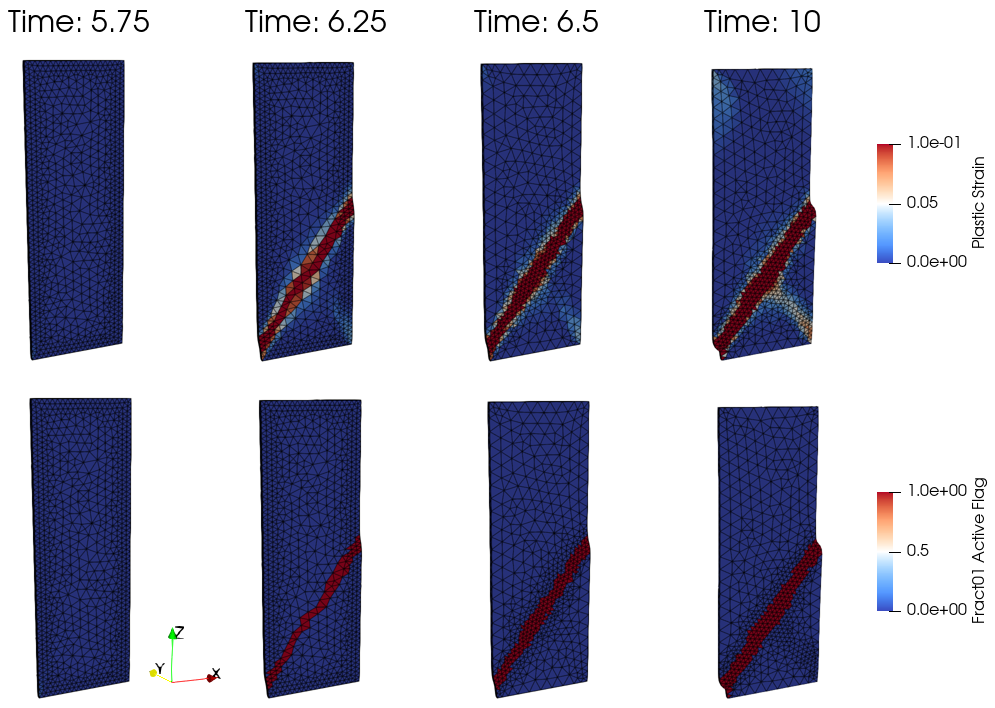
In the figure below the evolution of plastic strain and the active flag for the elements identified as being Fract01 for Case01a is shown. Note that the plastic strain maximum range is limited to the same input value as the one used to predict a fault (0.1) in order to highlight the correlation between the red elements in the plastic strain contours and the elements having a value of 1 of active fracture flag. As can be seen the model has predicted a strain localization dipping to the West boundary due to the imposed displacement on the top boundary. The strain localization initiated the bottom corner of the west boundary where the pore pressure values are higher at the time that deformation starts to take place.
Evolution of Plastic Strain and Fract01 Active Flag (values of 1 indicate that the element is identified as such fault) for Case01a. Note that plastic strain range has been limited to 0.1 to highlight the correlation with the elements predicted as faults. Note that the finer element size in the fault is due to the data defined in Adaptivity_set_data.
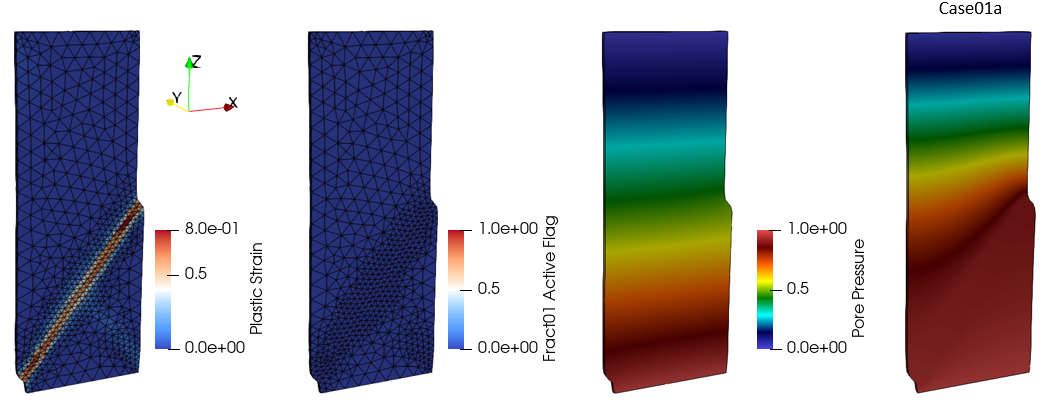
The results below at the end of the simulation show the predicted plastic strain, the elements being identified as fault elements, the enhanced perm in the fault elements and the pore pressure distribution for case01a. Note how the enhanced perm facilitated fluid flow along the fault resulting in a stronger pore pressure gradient in the eastern boundary than in the west boundary.
Results at the end of the simulation for Case01a.
The pictures below show the final results for case01b in which the data has been defined so that no fault elements are predicted (the plastic strain threshold has been set to 5.0 whereas the maximum predicted plastic strain value is 0.8). Note the horizontal pore pressure contours as the flow is mostly vertical because no preferential flow pathway has been created.
Results at the end of the simulation for Case01b.
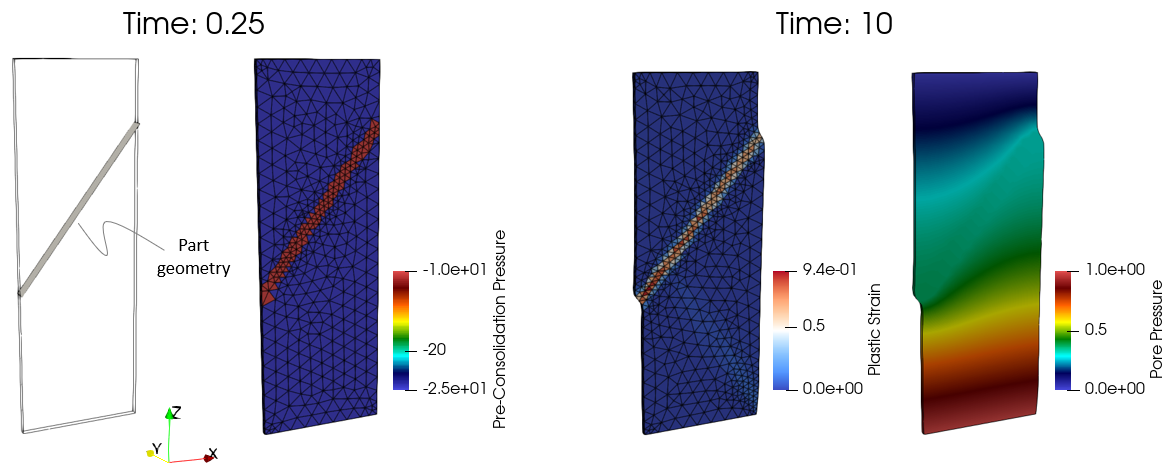
The figures below show the initial state and the final results for Case01c. In this case part geometry has been used to seed a fault decreasing the pre-consolidation pressure (strength) and enhancing the permeability in the fault elements. Due to the decreased strength at the prescribed fault pathway the strain localization is preferentially predicted at such location. The pore pressure contours reflect the perm enhancement at the prescribed location as well.
Pre-consolidation pressure decreased at seeded elements before any deformation has taken place at time 0.25 (left) and results at the end of the simulation (right) for Case01c.
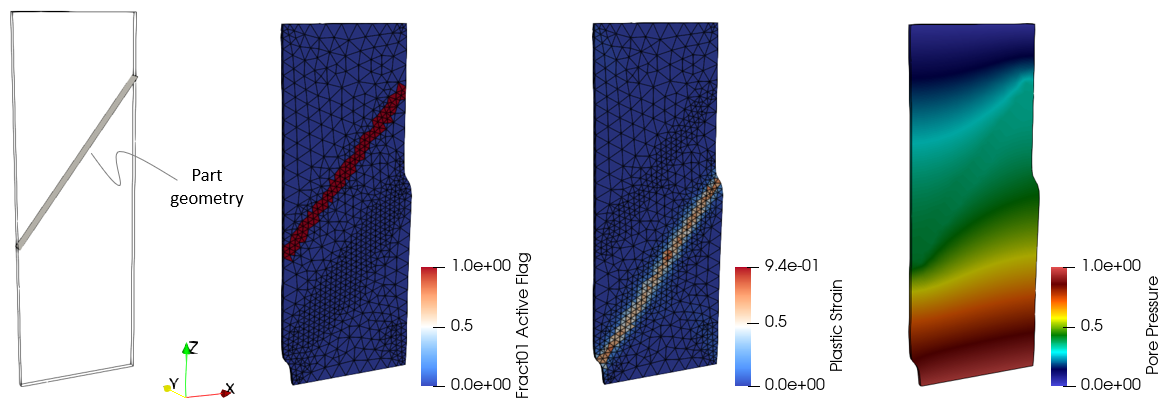
The figures below show the results for case01d which considers a prescribed fault at the same location as case01c but in the present case only perm enhancement at the fault location is considered (no strength reduction of the fault elements). As can be seen the strain localisation is predicted at the same location as Case01a due to the homogeneous strength in the domain although the preferential flow pathway occurs at the location where the fault is prescribed due to the perm enhancement.
Results at the end of the simulation for Case01d.
|

