Case 2 Poro-elasto-plastic simulation (SR4)
In this case the model configuration (geometry and boundary conditions) is identical to Case1. The only difference is in the material properties used for the simulation which in this case will incorporate SR4 Plasticity. For a description of the SR4 model and all its parameters see the Overview of SR4 model page.
The initial data file for the project is: IX_001\Data\IX_001_Case2.dat.
Material_data
Data File |
|
* Material_data NUM=1 ! --------------------------------- Material_name "Reservoir" Units IDM=4 /Stress/ "Pa" /Length/ "m" /Time/ "years" /Temperature/ "Celsius" Grain_stiffness 30000E6 Grain_density 2710 Porosity 0.15 Elastic_model_type 1 Elastic_properties IDM=2 /Young's Modulus/ 10000E6 /Poisson's Ratio/ 0.25 Porous_elasticity_type 1 Porous_elastic_properties IDM=2 /Reference Bulk modulus/ 10.0E6 /Unloading Modulus (Kappa)/ 0.02 ! -------------------------------------------------- Plastic_material_type 2 ! SR4 Plastic_properties IDM=9 /Tensile intercept/ 0.80E+06 ! Pa /Pre-consolidation pressure/ -25.0E+06 ! Pa /Friction parameter/ 68.0 ! Deg /Dilation parameter/ 66.0 ! Deg /Beta0 (deviatoric plane)/ 0.60 /Beta1 (deviatoric plane)/ 0.60 /Alpha (deviatoric plane)/ 0.25 /Exponent n/ 1.00 /Exponent m/ 1.00 Hardening_Type 3 Hardening_properties IDM=2 JDM=1 /"Loading Unloading Modulus (Kappa)"/ 0 /"Hardening Modulus (Lambda)"/ 0.1258 Regularisation_type 1 Regularisation_properties IDM=4 /"Characteristic Length (l(c))"/ 100.0 /"Constant (A)"/ 0.000 /"Exponent (n)"/ 0.600 /"Maximum Change Factor"/ 100.0 ! -------------------------------------------------- Permeability_type 2 Permeability_vs_porosity IDM=20 JDM=2 /Porosity/ 0.01 0.02 ... 0.5 /Permeab./ 0.000683 0.0054824 ... 85.6625 Biot_type 1 Biot_constant 1.0 Singlephase_fluid_name "Water"
* Fluid_properties NUM=1 ! --------------------------------- Name "Water" Fluid_type "Water" Density 1000 Stiffness 2000E6
|
1.The majority of the material properties are identical to Case1 and therefore will not be discussed here. The additional data to consider plasticity in this case is shown in bold. This comprises: a.Plasticity model and its relevant properties b.Hardening model and its relevant properties c.Regularisation model and its relevant properties
2.Plastic material is set to type 2 (SR4 critical state model).
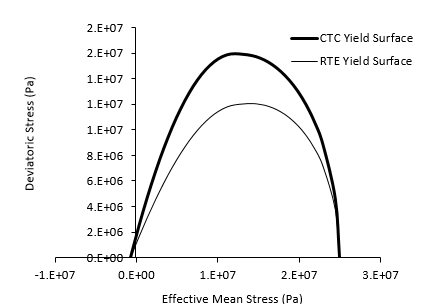
3.The required properties to define the SR4 model are specified. Those comprise: a.Reference tensile intercept (pt) and pre-consolidation pressure (pc) defining the intersection of the yield surface with the hydrostatic axis (zero deviatoric stress) in tension and compression respectively at reference porosity (defined as 0.15 in this case). b.Friction parameter and exponent n, which define the shape of the yield surface in the p' - q space. c.Dilation parameter and exponent m, which define the shape of the flow potential in the p' - q space. d.β0, β1 and α which define the shape of the yield surface in the deviatoric plane.
Defined yield surface at reference porosity in the p' - q space for the present case
4.Hardening type is set to 3 (analytical hardening).
5.Hardening parameters for the analytical hardening model are specified. Those comprise of Lambda and kappa. Note that given that the model considers poroelasticity, kappa specified in poroelastic properties will be used instead so that value specified in hardening properties becomes a dummy value.
6.Regularisation type is set to 1 (fracture energy regularization).
7.Regularization properties are specified. Those comprise: a.Characteristic length (for which is recommended to set a value of the order of the element length for field/reservoir scale simulations). b.A constant (for which a value of 0 is recommended). c.Material exponent n (typically 0.6). d.The maximum allowable change factor (recommended a value of 100).
|
Results
The result files for the project are in directory: IX_001\Results
Below there are plotted the evolution of stresses and pore pressure during the simulation. It is observed that: 1.Evolution of pore pressure is identical as in Case 1 as the Time_curve_data used to prescribed was identical. 2.The addition of plasticity in this case strongly influenced the evolution of stresses: a.From t=0 to t=1 it can be seen that contrary to poroelastic case in which effective mean stress (p') and deviatoric stress (q) have shown a negative correlation with pore pressure during the entire simulation, in this case there is an initial decrease of q followed by an increase in q during the initial phase of pore pressure decrease. This is due to the fact that the initial stress lies on the yield surface but not on the k0 path (uniaxial strain path due to burial or subsidence) so that when plasticity occurs due to the drop in pore pressure the stress path gradually moves towards the k0 path as can be seen in the central figure. Note that this occurs as the deformation (compaction) is expected to occur only in the vertical direction due to the weight of the overburden. The plasticity lead to a strength increase so that the yield surface increased from the initial yield surface (thin black line in the central figure) to the current yield surface at t=1 (blue line in the central figure). b.From t=1 to t=1.5 there is elastic unloading due to the pore pressure increase. Both p' and q decrease with the stress path following an elastic path with higher slope in the p' - q space than the plastic k0 path. c.From t=1.5 to t=2 there is pore pressure decrease reaching values which are lower than the minimum achieved so far so additional plasticity is expected. Initially the stress path shows an increase in both p' and q following the elastic path until it meets the yield surface at the k0 path. Passed that point additional plasticity occurs with the stress path following the k0 path. d.The effects of plasticity can easily be seen on the evolution of horizontal stress in the last drawdown phase from t=1.5 to t=2 where there is a change in the slope on plasticity onset around t=1.85.
Evolution of stresses and pore pressure
Below the evolution of porosity, Young's modulus and displacements are plotted. It can be seen that: 1.As expected there is a larger porosity reduction and subsidence than in poroelastic case due to the effect of plasticity. Note that the magnitude of displacement at the end of the simulation is of the order of 5 times the poroelastic displacement. 2.Young's modulus is also larger than in the poroelastic case. This is due to the larger effective mean stress increase relative to the poroelastic case which in turn is due to the higher rate of horizontal stress increase during plasticity. 3.Porosity recovery during elastic unloading is small compared to the porosity loss during plasticity.
Evolution of porosity, Young's modulus and displacements
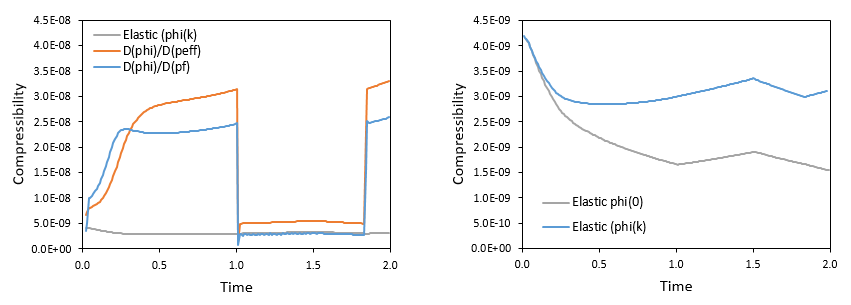
Below the evolution of the different compressibilities described in the results section of Case1 are plotted. It can be noted that: 1.As expected the plasticity results in an increase of the non-linear compressibility (pore volume compressibility). This is clearly noticeable during plastic phases where non-linear compressibilities are much higher than the elastic compressibility. 2.During the elastic unloading and reloading (t=1 to t=1.85) the pore volume compressibility is equal to the elastic compressibility as all strains are elastic. 3.Due to the larger porosity change during plasticity, there is a larger difference between the elastic compressibility as defined in ParaGeo which is evaluated using the current porosity and the elastic compressibility which is evaluated using the initial porosity (e.g. Dean et al. (2006)).
Evolution of the different compressibilities
|
References
Dean, R.H., Gai,X., Stone, C.M. and Minkoff, S.E. (2006). A comparison of techniques for coupling porous flow and geomechanics. SPE Journal, 11(1), 132–140.
|


