Case 1 Poroelastic simulation
In the first case for the PVC test simulation a poroelastic material will be considered.
Basic Set Up: Data file description
The initial data file for the project is: IX_001\Data\IX_001_Case1.dat. The basic data includes: 1A single Group_data structure for the single element and Group_control_data to define the group as active. 2A Material_data and Fluid_properties data structures defining the reservoir material properties. 3Geostatic_data to initialize the model at reservoir stress conditions . 4Two Global_loads data structures to define the vertical stress load (overburden) and the pore pressure load with their corresponding Time_curve_data structures. 5Load_case_control_data to define the previous loads as active during the simulation. 6Support_data defining the displacement constrains. 7Mesh control (Mesh_control) and Structured mesh generation data (Structured_mesh_data) defining a single element. 8Time_scaling_data defining a target optimal time step of 1.0E-4 hours. 9History_point data defining the variables that will be output. 10Control data (Control_data) for a single stage defining: (a) Incremental solution algorithm (Type 1), (b) Maximum number of time steps of 1E8 (c) Duration of t=2 hours, (d) Factor of critical time step = 0.25, (e) Plot file output every 0.1 hour of simulated time, (f) Plot file output at the end of the stage, (g) Screen message output every 1000 mech steps, 11Geometry data (nodal_data, Geometry_line and Geometry_surface) for definition of the 2D geometry.
|
Results
The result files for the project are in directory: IX_001\Results
From the three figures below it can be seen that: 1.The pore pressure evolves as prescribed in the Time_curve_data NUM=2. It starts with a value of 82.5·106 Pa and decreases to a value of 55·106 Pa at t=1. From t=1 to t=1.5 pore pressure increases to 65·106 Pa and finally from t=1.5 to t=2 it drops to 50·106 Pa. 2.When pore pressure decreases effective stresses increase and vice-versa following Terzaghi 's law for effective stress. 3.As expected the change in vertical effective stress (Stress YY) is larger than the change in horizontal stress (Stress XX) as the total stress in vertical direction is constant and equal to the overburden weight whereas in horizontal direction the stress changes due to Poisson's ratio effects as displacements are constrained. 4.As expected, due to the poroelastic assumptions, during unloading (pore pressure increase) the stress path in p'-q space follows the same path as when reloading (pore pressure increase).
Evolution of stresses and pore pressure
In the figures below the evolution of porosity, Young's modulus and displacements during the simulation is shown. It can be seen that: 1.There is a positive correlation between porosity and pore pressure. When pore pressure decreases, effective stresses increase causing compressive elastic volumetric strains what results in porosity reduction. The opposite occurs when pore pressure increases. It should be noted that porosity change is small due to the poroelastic assumptions (strains are elastic). 2.There is a negative correlation between Young's modulus and pore pressure due to the assumed poroelastic law which considers that the bulk modulus (and hence Young's modulus) is a function of the effective mean stress. Thus, when effective mean stress increases (due to a drop in pore pressure) Young's modulus also increases. The opposite occurs when pore pressure increases. 3.A decrease in pore pressure results in subsidence (negative displacements) due to the elastic compressive strains. The opposite occurs when there is a pore pressure increase.
Evolution of porosity, Young's modulus and displacements
Different compressibilities for the reservoir can be calculated. Those are: •Pore volume compressibility (neglecting temperature effects), which stands for the porosity change due to changes in pore pressure (D(phi)/D(pf) in the graph):
•Compressibility as a function of the change in the effective mean stress (D(phi)/D(peff) in the graph):
•Elastic compressibility:
Where:
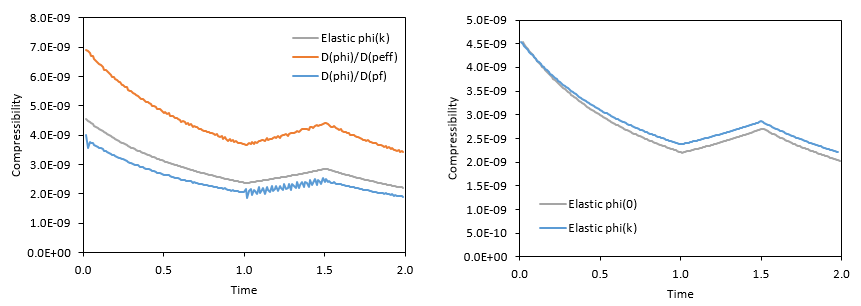
In the left figure below the evolution of the different calculated compressibilities can be seen. It can be noted that: 1.There is a small difference between the elastic compressibility and the pore volume compressibility. 2.There is a significant difference between the pore volume compressibility and the compressibility that accounts for the change in the effective mean stress. This is due to the fact that even though the total vertical stress is constant (as overburden weight is constant) the total horizontal stress varies. Therefore, even for the present case in which Biot's constant is 1.0, the change in pore pressure does not coincide whit the change in the effective mean stress.
In the figure on the right hand side there is compared the evolution of the elastic compressibility as defined in ParaGeo (phi(k) in the figure) with a definition of the elastic compressibility found in the literature (e.g. Dean et al. (2006), phi(0) in the plot) which is calculated as:
Note that the difference relative to the ParaGeo definition of the elastic compressibility is that it is evaluated considering the initial reference porosity for the reservoir (
Evolution of the different compressibilities
|
References
Dean, R.H., Gai,X., Stone, C.M. and Minkoff, S.E. (2006). A comparison of techniques for coupling porous flow and geomechanics. SPE Journal, 11(1), 132–140.
|


