Case 1b Poro-elasto-plastic simulation (SR4)
In this case the model configuration (geometry and boundary conditions) is identical to Case1a. This case only differs in the material properties used for the simulation which incorporate SR4 Plasticity. For a description of the SR4 model and all its parameters see the Overview of SR4 model page. Fracture data is also the same as in Case1a.
The initial data file for the project is: Mat_003\Case1\Data\Mat_003_Case1b.dat.
Material_data
Data File |
|
* Material_data NUM=1 ! --------------------------------- Material_name "Reservoir" Grain_stiffness 30000E6 Grain_density 2710 Porosity 0.15 Elastic_model_type 1 Elastic_properties IDM=2 /Young's Modulus/ 10000E6 /Poisson's Ratio/ 0.25 Porous_elasticity_type 1 Porous_elastic_properties IDM=2 /Reference Bulk modulus/ 10.0E6 /Unloading Modulus (Kappa)/ 0.02 ! ----------------------------------------------------------- Plastic_material_type 2 ! SR4 Plastic_properties IDM=9 /Tensile intercept/ 0.800E+06 ! Pa /Pre-consolidation pressure/ -25.00E+06 ! Pa /Friction parameter/ 68.0 ! Deg /Dilation parameter/ 66.0 ! Deg /Beta0 (deviatoric plane)/ 0.60 /Beta1 (deviatoric plane)/ 0.60 /Alpha (deviatoric plane)/ 0.25 /Exponent n/ 1.00 /Exponent m/ 1.00 Hardening_Type 3 ! Analytical Hardening_properties IDM=2 JDM=1 /"Loading Unloading Modulus (Kappa)"/ 0 /"Hardening Modulus (Lambda)"/ 0.1258 Regularisation_type 1 ! RegParaGeo1 Regularisation_properties IDM=4 /"Characteristic Length (l(c))"/ 100.0 ! m /"Constant (A)"/ 0.000 /"Exponent (n)"/ 0.600 /"Maximum Change Factor"/ 100.0 ! ----------------------------------------------------------- Permeability_type 2 Permeability_vs_porosity IDM=20 JDM=2 /Porosity/ 0.01 0.02 ... 0.5 /Permeab./ 0.005711 0.045687 ... 713.8542 Biot_type 1 Biot_constant 1.0 Singlephase_fluid_name "Water" Fracture_set_names IDM=1 "Type_A"
* Fluid_properties NUM=1 ! --------------------------------- Name "Water" Fluid_type "Water" Density 1000 ! Kg/m3 Stiffness 2000E6 ! MPa
|
1.The majority of the material properties are identical to Case1a and therefore will not be discussed here. The additional data to consider plasticity in this case is shown in bold. This comprises: a.Plasticity model and its relevant properties b.Hardening model and its relevant properties c.Regularisation model and its relevant properties
2.Plastic material is set to type 2 (SR4 critical state model).
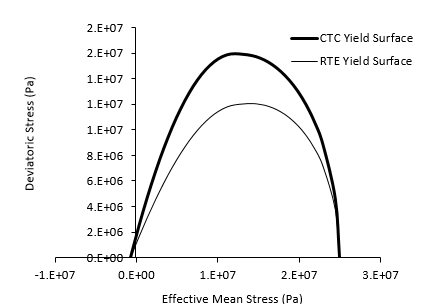
3.The required properties to define the SR4 model are specified. Those comprise: a.Reference tensile intercept (pt) and pre-consolidation pressure (pc) defining the intersection of the yield surface with the hydrostatic axis (zero deviatoric stress) in tension and compression respectively at reference porosity (defined as 0.15 in this case). b.Friction parameter and exponent n, which define the shape of the yield surface in the p' - q space. c.Dilation parameter and exponent m, which define the shape of the flow potential in the p' - q space. d.β0, β1 and α which define the shape of the yield surface in the deviatoric plane.
Defined yield surface at reference porosity in the p' - q space for the present case
4.Hardening type is set to 3 (analytical hardening).
5.Hardening parameters for the analytical hardening model are specified. Those comprise of Lambda and kappa. Note that given that the model considers poroelasticity, kappa specified in poroelastic properties will be used instead so that value specified in hardening properties becomes a dummy value.
6.Regularisation type is set to 1 (fracture energy regularization).
7.Regularization properties are specified. Those comprise: a.Characteristic length (for which is recommended to set a value of the order of the element length for field/reservoir scale simulations). b.A constant (for which a value of 0 is recommended). c.Material exponent n (typically 0.6). d.The maximum allowable change factor (recommended a value of 100).
|
Results
The result files for the project are in directory: Mat_003\Case1\Results
This example is identical to Case1a except that SR4 plasticity is included in the constitutive response of the matrix. Most of the figures will highlight the differences between the two cases.
In the figures below the evolution of stresses and pore pressure is shown. It can be noted that: 1.As in the poroelastic case the stresses show a negative correlation with pore pressure
2.As in the poroelastic case effective stress in Y direction is lower than effective stress in X direction due to the contribution of the fractures (which are perpendicular to Y axis and therefore accommodate some of the stress in the form of fracture displacement)
3.The stress path in the p'-q space (effective mean stress - deviatoric stress space) shows that:
a.The initial stress state is on the initial yield surface (black thin line) near the peak strength (point a).
b.From t=1.0 to t= 2.0 days pore pressure decreases. The stress path moves initially from point "a" to "b" towards the k0 path (stress path under burial conditions in which generally σ'z > σ'x = σ'y for intact samples). This is expected as the decrease in pore pressure causes plasticity (compaction) driven by the overburden stress. Note that the plastic path is not exactly on the k0 path due to the influence of the fractures that result in σ'x > σ'y. Then the path moves from point "b" to "c" following the burial path. During that period the strength of the material has increased due to plastic hardening as shown by the yield surface size increase (from initial yield surface which is the thin black line to the blue yield surface).
c.From time t=2.0 to t=2.5 days pore pressure increases leading to stress decrease due to unloading. The stress path moves following an elastic path with decreasing p' and q from "c" to "d".
d.From time t=2.5 to t=3.0 days pore pressure decreases and hence stresses increase. Initially the stress path moves elastically from "d" to "c" following the same unloading path until pore pressure reaches the previous minimum value at time c.a. t=2.8. Then the stress path moves from "c" to "e" and there is more plastic compaction with hardening with a yield surface size increase (from the blue surface to the thick black surface).
Evolution of stresses and pore pressure
Comparison of the evolution of vertical displacement, porosity and permeability for poroelastic (Case1a) and poro-elasto-plastic cases (present case) is shown in the next figure. As expected plasticity leads to larger displacements and larger porosity and permeability reduction. It can be noted that during the elastic unloading/reloading stage changes in displacement, porosity and permeability are smaller than in plastic phases as only the elastic strains are recovered (see for example the change in slope in porosity curve at time c.a. t=2.8 days).
Comparison of displacement, porosity and permeability for Case1a (poroelasticity) and Case1b (SR4 plasticity)
The evolution of the different compressibilities is shown on the following figures (see Case1a results section for an explanation on the different compressibilities). It can be observed that:
1.In the first figure on the left it can be seen that the pore volume compressibility (D(phi)/D(pf)) and the pore volume compressibility as a function of p' (D(phi)/D(peff)) are much larger than the elastic compressibility (Elastic phi(k) )during the plastic phases (time t=1.0 to t=2.0 days and t=2.8 to t=3.0 days). This is consistent with the larger porosity loss observed for the present case considering plasticity compared to the case considering poroelasticity only. During the elastic phase (t=2.0 to t=2.8 days) it can be seen that the pore volume compressibility coincides with the elastic compressibility because all the porosity change is elastic. The pore volume compressibility relative to the effective mean stress does not coincide because as explained in the results section of Case1a the change in effective mean stress is different than the change in pore pressure.
2.In the center figure it can be seen that the elastic compressibility in ParaGeo (which is defined as a function of the current porosity) differs substantially to the elastic compressibility as defined in the literature (which is defined as a function of the initial porosity, e.g. Dean et al. 2006) due to the large plastic porosity loss.
3.For the poroelastic and plastic cases there is a difference in the elastic compressibility as defined in the literature even though the initial porosity is the same for both cases (0.15). This difference is attributed therefore to the difference in Young's modulus that will be discussed below in the next figures below.
Evolution of the different compressibilities (left and center). Comparison of elastic compressibilities (based on initial porosity) for Case1a (poroelasticity) and Case1b (SR4 plasticity)
As seen in the following figures Young's modulus is different for poroelastic and plastic cases. In both cases Bulk modulus (and hence Young's modulus) is a function of the effective mean stress so that the larger the p' the larger the Young's modulus. Thus the larger values of the Young's modulus for the case with SR4 plasticity must imply larger values of the effective mean stress as shown in the central figure. Also it is noteworthy to note that the difference in p' results from the larger horizontal stresses in the plastic case. This is expected as in the poroelastic case horizontal stresses can only develop due to the Poisson's ratio effect on strain upon elastic vertical strain whereas in the plastic case larger horizontal stresses can develop due to the plastic consolidation. It should be noted that the slight difference in the initial Young's modulus and effective mean stress value between the poroelastic and plastic cases (at time t=1.0 days) is attributed to little plasticity which occurred during the initialisation stage.
Comparison of the evolution in Young modulus and effective stresses
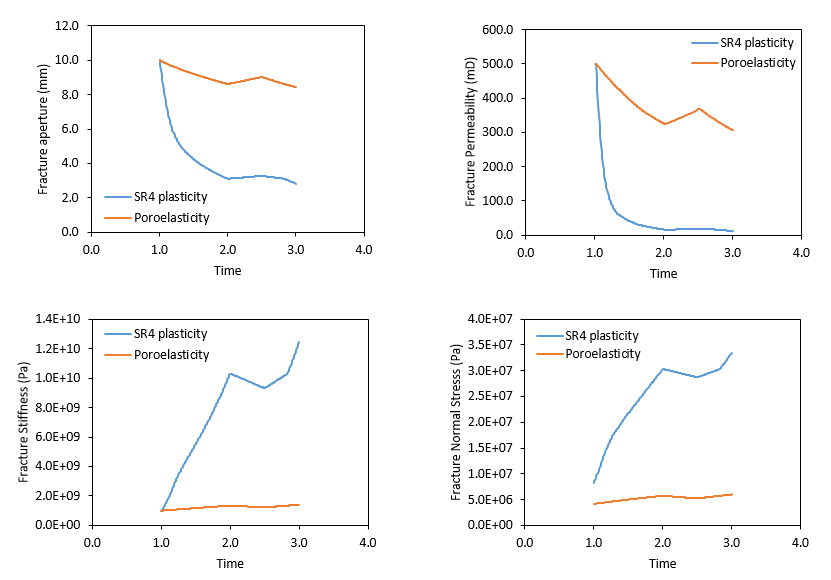
Comparison of the evolution of fracture properties for poroelastic and plastic cases is shown in the figures below. As mentioned above, in the poroelastic case horizontal strains (and hence stresses) develop due to Poisson's ratio effect. On the other hand in the case considering plasticity horizontal strains resulting from vertical plastic consolidation are much larger. This has also an impact in fracture properties as in the plastic case there is more fracture displacement which decreases fracture aperture. Consequently fracture permeability (which depends on fracture porosity) in reduced more drastically. For the same reason fracture normal stiffness (which increases as fracture aperture decreases) and fracture normal stress are larger in the case with plasticity than in the case considering only poroelasticity.
Comparison of the evolution of fracture properties for cases 1a (poroelasticity) and 1b (SR4 plasticity)
In the figures below comparison of matrix porosity and permeability and fracture permeability as a function of pore pressure for the two cases is provided. The differences between the two cases have already been discussed above.
Comparison of porosity and matrix and fracture permeabilities for Case1a (poroelasticity) and Case1b (SR4 plasticity)
|
References
Dean, R.H., Gai,X., Stone, C.M. and Minkoff, S.E. (2006). A comparison of techniques for coupling porous flow and geomechanics. SPE Journal, 11(1), 132–140.
|


