The present case demonstrates the workflow for reading in of a previous simulation result plot file and mapping/projection of these results onto a spatial surface defined by Abaqus .inp format, then output to a new plot file. The data and files associated with this workflow comprise:
•previous simulation result plot file in this case will be the final plot file for Case03b, i.e. MEM_001_Case03b_027.xmf and .plt
•new output plot file will be named "MEM_001_Case05"
•imported mesh file in Abaqus .inp format to be converted into spatial surface will be in the same location as the fault geometry for Case03b but with a fault offset of 100m and defined with Coulomb stress related properties
The data files for the project are in: MEM_001\Case05\Data.
Data Definition
Spatial Surface
Data File
|
|
* Spatial_surface NUM=1
Name "Fault_pg"
Import_file_name "MEM_001_Case05_Spatial_Fault.inp"
Import_type "Abaqus"
Coulomb_properties IDM=2
0.0
0.2
Offset 100
|
1In this example, the Spatial_surface data structure allows the mapping/projection of a previous simulation result plot file onto a spatial surface defined by an imported Abaqus .inp mesh file. In addition, the spatial surface is defined Coulomb properties and an offset distance: a.Name defines the name of the spatial surface(maximum of 32 characters). Note that if only one surface is defined in the .inp file, this name will appear in the output plot file, otherwise the .inp surface definition name will be used. b.Import_file_name defines the file name associated with the imported mesh file for conversion into spatial surface. c.Import_type defines the format type of the imported file. d.Coulomb_properties defines the cohesion c and friction coefficient μ values used to compute the Coulomb stress ratio and Coulomb failure/stress flag on the spatial surface. These are defined as: i.Coulomb stress ratio = τ/C where C = Max ((-μ*σ3+c), 0) and τ is shear stress and σ3 is the compressive stress which is negative. ii.Coulomb failure/stress flag = 1 if (τ > C), else = 0. e.The Offset keyword is used in this example as the spatial surface is defined in the same location as the fault/contact surface for the plot file that will be read in and mapped. When the Offset keyword is defined, a hangingwall and footwall spatial surface will be output to the new plot file. These surfaces will be separated in the normal direction by the distance defined in Offset. The target is to capture the results on both sides of the contact surface. |
Read Plot File
Data File
|
|
* Read_plt_file
File_name "MEM_001_Case03b_027.plt"
Output_file_name "MEM_001_Case05"
|
1The Read_plt_file data structure defines the File_name of the results to be read in for mapping and Output_file_name defines the file name for the new plot file containing the mapped spatial surface results.
Notes:
•The mapped element results on the spatial surface will be appended with "Spatial" in the new plot file. |
|
Results
The results for the example are located in MEM_001\Case05\Results.
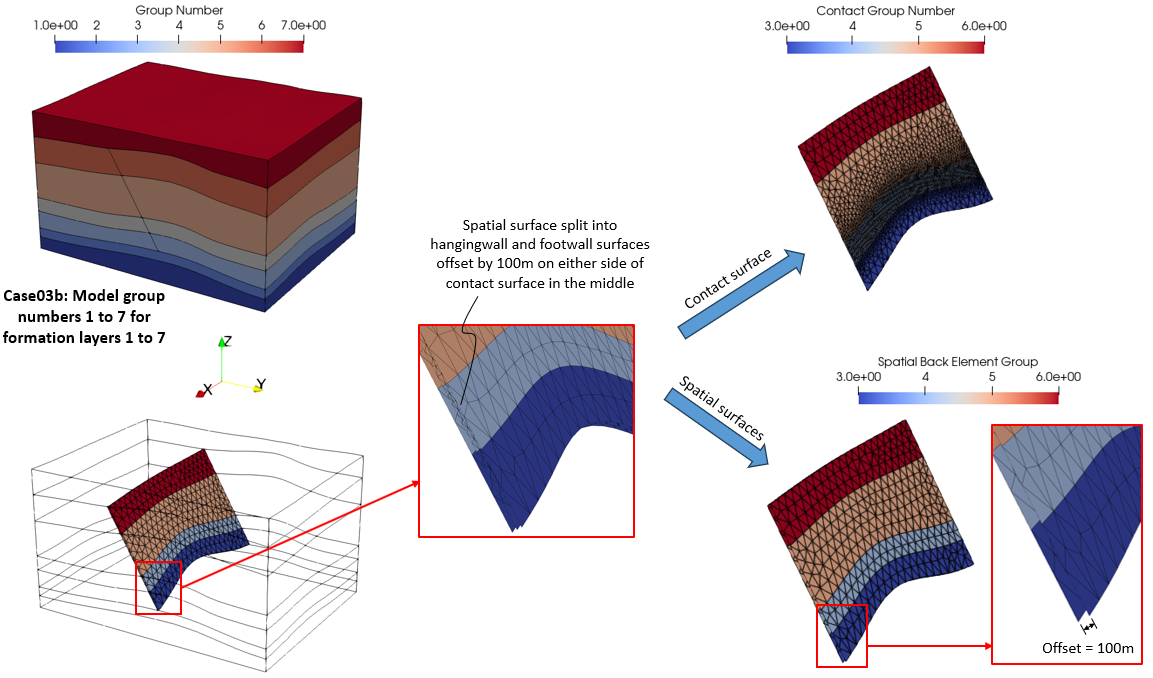
The picture below shows contour plots of element group numbers on the domain and contact surface and the correctly mapped element group numbers on the spatial (hangingwall and footwall) surfaces which are located at the same position as the contact surface but with an offset of 100m (i.e. 50m on either side of the contact surface).

Contour plots of element group numbers on contact surface and projection onto Spatial (Hangingwall and Footwall) surfaces at same location
The picture below shows the final results for pore pressure contours and it's projection onto the spatial hangingwall and footwall surfaces.

Case03b domain pore pressure final results projected onto Spatial (Hangingwall and Footwall) surfaces
|


