The current case is identical to Case02a but using the COMP flow mode as opposed to COMP3. The COMP flow mode is a multi-component model for modelling CO2 storage in more complex depleted hydrocarbon fields as it allows definition of an arbitrary number of components. However in the current case the same 3 components as in the previous Case02a will be defined. Thus, only key differences relative to the previous case will be discussed.
The files for the current case are provided in PFO_001\Case02b\Data. These comprise:
•PFO_001_CASE02B.dat input data file for the geomechanical model (ParaGeo)
•PFO_001_CASE02B.in input data file for the flow model (Pflotran-OGS)
•fluid_data: folder containing data files for CO2 equation of state database and saturation functions which are required for the flow simulation in Pflotran-OGS. Note that an additional file is provided in the present case (SOF3.dat)
•grdecl_data: folder containing the grid data for the flow model previously generated in Case01 Grid Generation
Note that the ParaGeo input data file is identical to that in Case02a so it will not be discussed here.
Pflotran input data
Simulation Block
Data File
|
|
SIMULATION
SIMULATION_TYPE SUBSURFACE
PROCESS_MODELS
SUBSURFACE_FLOW Flow
MODE COMP 3 EOS
OPTIONS
ISOTHERMAL
RESERVOIR_DEFAULTS
/
/
GEOMECHANICS_EXTERNAL
DATA_FILE PFO_001_CASE02B.dat
TRANSFER_METHOD memory
/
/
END
|
•Within SUBSURFACE_FLOW the MODE option is set to "COMP 3 EOS" indicating that the COMP flow mode with 3 components will be used.
•The COMP model is currently only available for ISOTHERMAL simulations (Pflotran-OGS 1.8 version), i.e. thermal field is not solved.
|
Material properties
Note that as the thermal field is not solved, the following properties are not required to be defined in Material properties:
•ROCK_DENSITY •SPECIFIC_HEAT •THERMAL_CONDUCTIVITY_DRY •THERMAL_CONDUCTIVITY_WET
Saturation functions
The additional fluid input file (SOF3.dat) defines the relative permeabilities of oil to water (Kow) and oil to gas (Kog). Note that as no oil phase is considered, the input relative perms are all 0.
Data File
|
|
CHARACTERISTIC_CURVES ch1
KRW_TABLE swfn_table
KRG_TABLE sgfn_table
KRO ECLIPSE
KRO_TABLE sof3_table
END
TABLE swfn_table
PRESSURE_UNITS psi
external_file fluid_data/SWFN_psi.dat
END
TABLE sgfn_table
PRESSURE_UNITS psi
external_file fluid_data/SGFN_psi.dat
END
TABLE sof3_table
external_file fluid_data/SOF3.dat
END
/
|
•KRW_TABLE uses the data defined in the SWFN_psi.dat file which contains three columns defining: ▪C1: Water saturation (Sw) ▪C2: Relative permeability of water (Krw) ▪C3: Water-Gas capillary pressure (PCwg)
•KRG_TABLE uses the data defined in the SGFN_psi.dat file which contains three columns defining: ▪C1: Gas saturation (Sg) ▪C2: Relative permeability of gas (Krg) ▪C3: Oil-Gas capillary pressure (PCog)
•KRO_TABLE uses the data defined in the SOF3.dat file which contains three columns defining: ▪C1: Oil saturation (So) ▪C2: Relative permeability of oil to water (Kow) ▪C3: Relative permeability of oil to gas (Kog) |
Fluid properties
An analytical Peng-Robinson equation will be used to model the state of the components. When using the COMP flow model the properties are input in a tabular form under the EOS COMP card.
Data File
|
|
FLUID_PROPERTY
PHASE LIQUID
DIFFUSION_COEFFICIENT 2.0d-9
/
FLUID_PROPERTY
PHASE GAS
DIFFUSION_COEFFICIENT 2.0d-5
/
EOS WATER
SURFACE_DENSITY 1000.0 kg/m^3
END
EOS COMP
PREOS
PRCORR
GCOND
CNAME C02 C1
TCRIT K 304.70 190.60
PCRIT psi 1071.33466573 667.783912359
ZCRIT 0.274072123685 0.28472358244
ACF 0.225 0.013
MW 44.01 16.043
PARACHOR 78 77
OMEGAA 0.457235529 0.457235529
OMEGAB 0.077796074 0.077796074
SHIFT -0.04958 -0.1486264
END
|
•EOS COMP is the card used to specify the EOS properties for the different components in a tabular form as required for the COMP flow mode .
•PREOS is used to specify that a Peng-Robinson equation of state will be used.
•GCOND specifies a gas condensate reservoir.
|
Equilibration
Data File
|
|
EQUILIBRATION
PRESSURE 13.5 MPa
DATUM_D 1350 m
OGC_D 1500 m
OWC_D 1500 m
PCOG_OGC 0.0 Bar
PCOW_OWC 0.0 Bar
ZMFVD m frac
1350 0.0 1.0
1400 0.0 1.0
END
TEMPERATURE_TABLE
D_UNITS m
TEMPERATURE_UNITS C
RTEMPVD
0.0 10.0
1500.0 62.5
/
END
/
|
•OGC_D and OWC_D define the Oil-Gas and the Oil-Water contact depths respectively. These are set to 1500 m (below the reservoir bottom surface) because the objective is to model a reservoir which is initially full of gas.
•PCOG_OGC and PCOW_OWC define the capillary pressure between oil and gas and oil and water respectively at their respective contact depths.
•ZMFVD is used to define the reservoir non-aqueous phase composition versus depth for COMP flow mode. The three columns indicate the depth, CO2 molar fraction and C1 molar fraction respectively (the order of the molar fractions corresponds to the same order used to specify the different components in the EOS COMP card). |
Wells
Because of the different flow mode used here relative to the previous Case02a, the WELL_DATA for the injection is changed slightly.
Data File
|
|
WELL_DATA prod
CIJK_D 1 1 3 4
WELL_TYPE PRODUCER
THETA_FRACTION 0.25
BHPL 5 MPa
SHUT
TIME 1 y
OPEN
TARG_GM 0.1 Mt/year
TIME 21 y
SHUT
END
WELL_DATA injg
CIJK_D 1 1 3 4
WELL_TYPE GAS_INJECTOR
ZINJ FRAC 1.0 0.0
THETA_FRACTION 0.25
BHPL 25 MPa
SHUT
TIME 25 y
OPEN
TARG_GM 0.25 Mt/year
TIME 45 y
SHUT
END
|
•WELL_TYPE is set to GAS_INJECTOR (as opposed to SOLVENT_INJECTOR used in the previous Case02a).
•ZINJ FRAC is used to specify the molar fraction components of the injected phase when using the COMP mode. In the current case, the CO2 injection is defined as 1 molar fraction for component 1 (CO2) and molar fraction of 0 for component 2 (Gas). Note that the order of molar fractions correspond to the same order of components specified in the EOS COMP card.
•TARG_GM card is used in the current case as opposed to TARG_SM used in the previous Case02a.
|
|
Results
The results discussed here consist of the hdf format ParaGeo output results which are provided in PFO_001\Case02b\Results\PFO_001_CASE02B_parageo_results. Note that as the user is assumed to be familiar with Case01 the different result types being output by Pflotran-OGS or the Eclipse format results from ParaGeo will not be discussed.
Very similar results to Case02a are obtained with small differences observed for:
▪Water saturation is slightly larger throughout the whole simulation ▪Consequently the saturations for gas and CO2 are slightly lower ▪Temperature is constant through the simulation due to the limitation that the COMP mode is only available for ISOTHERMAL simulation (i.e. thermal field is not solved)
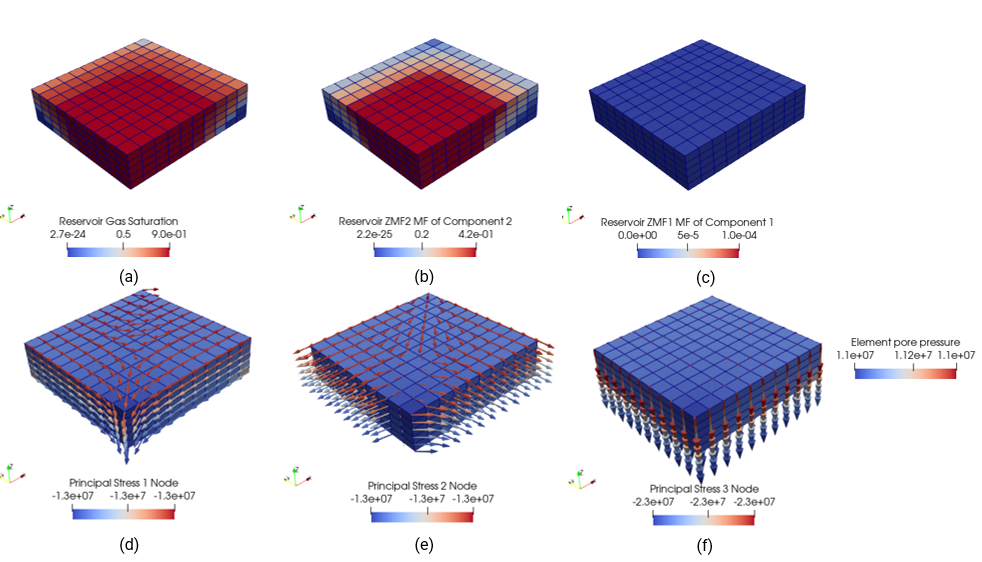
Contour plots for gas saturation (a), component 2 methane gas mass fraction (b) component 1 CO2 mass fraction (c) and pore pressure with principal stress directions and magnitudes indicated by the coloured arrows (d, e, f) after 20 years of gas depletion (t =21 years)
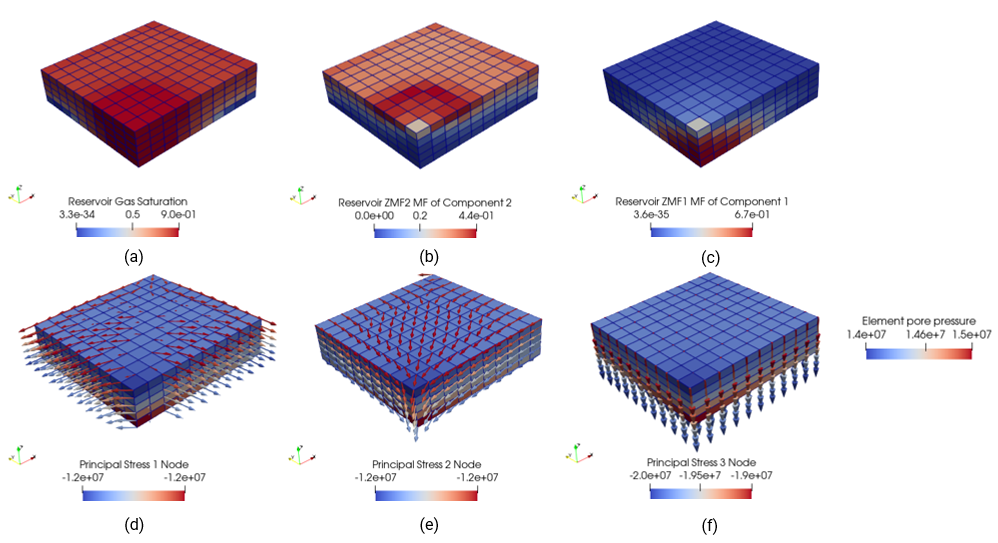
Contour plots for gas saturation (a), component 2 methane gas mass fraction (b) component 1 CO2 mass fraction (c) and pore pressure with principal stress directions and magnitudes indicated by the coloured arrows (d, e, f) after 20 years of CO2 injection (t =45 years)
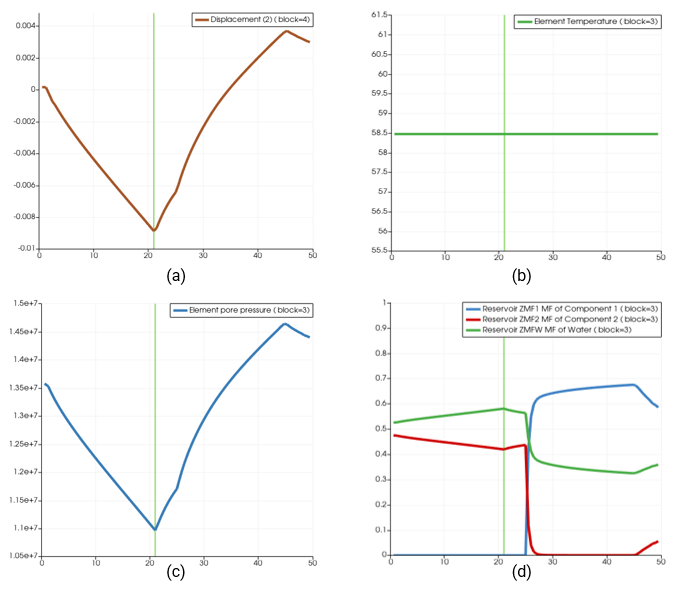
Evolution of vertical displacement at top surface in a cell aligned with well location (a). Evolution of element temperature (b), pore pressure (c) and the three components mass fractions (d) in a well cell
|
