Case03 Modelling Erosion
The aim of the present case is to demonstrate an approach to account for deposition and subsequent erosion of formations within the restoration to forward modelling workflow. This will be demonstrated by following the workflow for 3D hexahedral meshes but the same concept can be applied in other workflows (e.g. the 2D workflow demonstrated in Geol_001 tutorial). The key of the approach presented here is to account for the deposition and erosion of the eroded formations during the restoration phase so that the boundary displacements required to create the accommodation space for deposition and subsequent displacements to expose the sediments to erosion during forward modelling can be obtained. A necessary assumption to achieve that is to consider erosion on full formations / ParaGeo groups (as opposed to partially erode formations based on the intersection of the geometry with a defined erosion datum as demonstrated in Ex_005 cases 03 and 03b).
In the figures below the mentioned approach for modelling erosion is illustrated. The initial considered present day geometry consists of 3 formations. Between the blue and yellow formations there is missing sediment which was eroded prior to the deposition of the blue formation. The thickness of the eroded sediment at each location is known and given by h(x) in this example (usually obtained from an erosion map). Then we will introduce such sediments as an eroded formation in restoration and forward simulation.
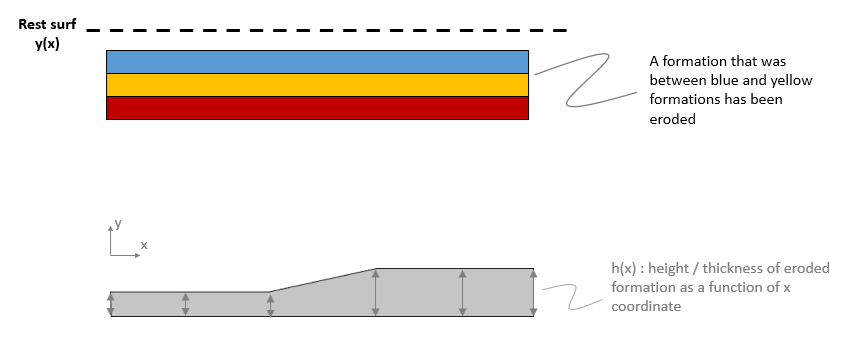
Initial conceptual geometry (top) and erosion map (bottom)
In the forward sense, modelling the deposition and subsequent erosion of a given formation requires the following events:
1.Generate the accommodation space for deposition of the missing / eroded formation
2.Deposition of the eroded formation.
3.Subsequent uplift of the eroded formation to "expose it to erosion".
4.Removal of the eroded formation
5.Carry on with generation of the accommodation space for the subsequent formation.
Consequently, in the restoration - forward simulation workflow the restoration boundary conditions must be chosen carefully to represent the same events in the backward / reverse sense to obtain the appropriate basal displacements for the forward model. In the figure below the sequence when considering the eroded formation in restoration and forward simulation are shown and it is as follows:
•The initial model starts at picture 00. The assumed restoration surface in this schematic example is flat and given by y(x) = constant. The first stage is a translate operation so that the blue formation is flattened at the end as shown in 01.
•In the next stage the blue formation is deactivated (removed) and the next formation to consider would be the eroded formation (not present in the geometry). During this stage we are restoring the erosion event of the eroded formation. To do that the yellow formation is flattened as shown in 02. Then if the eroded formation would have been explicitly represented in the geometry it will be placed above the restoration surface (see the semi-transparent grey surface in 02). In the forward simulation this state corresponds to the end of uplift and exposure of the eroded formation above the "erosion datum".
•In the next stage we will simulate the flattening of the top surface of the eroded formation. However the eroded surface is not present in the geometry. In order to represent such state we change the restoration surface so that at each X coordinate we subtract the thickness of the eroded formation to the Y coordinate of the flat restoration surface. We perform a translate operation so that we enforce that the top of the yellow formation is displaced to this new restoration datum as shown in picture 03. Note that the top of the yellow surface corresponds to the base of the eroded formation and the obtained state would be approximately equivalent to the flattening the top surface of the eroded formation (also displayed in picture 03). Hence from this step the boundary displacements required to create accommodation space for the deposition of the eroded formation will be derived.
•Then, during next restoration stage the eroded formation would be removed and the next formation (the yellow one) would be flattened to the restoration datum. As the erode formation is not explicitly modelled we achieve that by updating the restoration surface back to the original flat surface and performing another translate operation of the yellow top surface as shown in 04.
•Then restoration continues as usual.
As shown in the sequence, with the extra stages added in the restoration the forward simulation will consider deposition of the eroded formation thanks to the created accommodation space as shown in 03, subsequent exposure of such formation above the sedimentation horizon and its erosion as shown in 02, and then followed by deposition of the blue formation as shown in 01. Note that erosion in 02 will not be performed by calculating the intersection between the sedimentation/erosion horizon and the geometry as demonstrated in Ex_005 but using Deactivation_data structure in order to remove the specified formation.
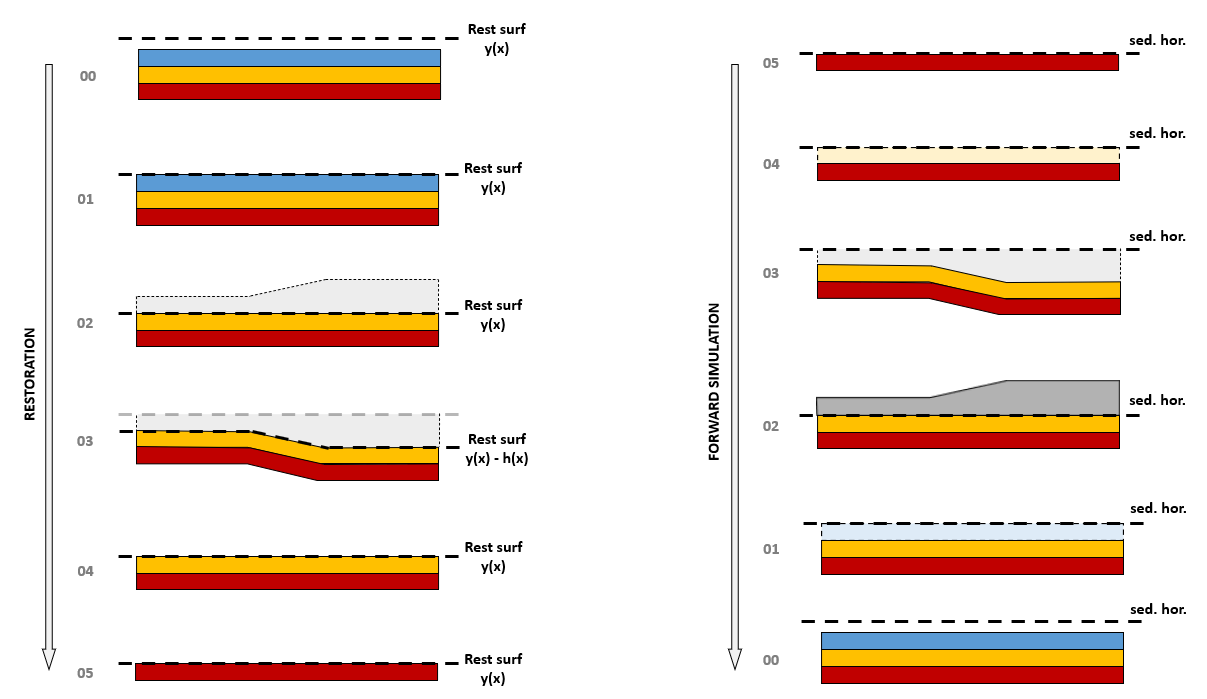
Sequence of restoration and forward simulation accounting for an eroded formation. The semitransparent formation in 02 and 03 from restoration sequence indicates the eroded formation, which is not explicitly modelled. The semi transparent formations in 04, 03 and 01 from the forward simulation sequence indicate the space that will be filled with new sediments / formations.
Another important aspect to take into account when modelling eroded layers in the restoration - forward simulation workflow is to make the appropriate decompaction assumptions in order to maximize consistency between formation thicknesses in the restoration and the forward simulation. In the figure below the compaction state in each formation during forward modelling is illustrated. The deposition - and erosion sequence as well as the formation colours have been maintained consistent with the previous example to facilitate understanding. The pink line represents a linear compaction curve common to all formations and is superimposed in the picture to illustrate the porosity - depth trend at each step. For example at step 02, before the yellow formation is deposited, the red formation follows the compaction trend starting from the depositional porosity at its top surface. Then yellow formation is deposited and due to its weight, the red formation compacts further and now, at step 03, before the grey formation is deposited, both yellow and red formation follow the compaction trend. The key for erosion modelling is to note how after erosion the yellow and red formations are over-consolidated (states 04 and 05) with the porosities in all depths being lower than the normal compaction trend. Hence, when the next formation is deposited (blue one in this case), the yellow and red formations are already over-compacted and would compact further only if the loading weight of the blue formation is sufficient to increase the stresses beyond their pre-consolidation pressures (for simplicity in this case it is assumed that all formation thicknesses and weights are the same so the red and yellow formations will not compact further upon sedimentation of the blue one). Thus during restoration the decompaction assumptions at each stage must be chosen carefully to ensure consistent histories.
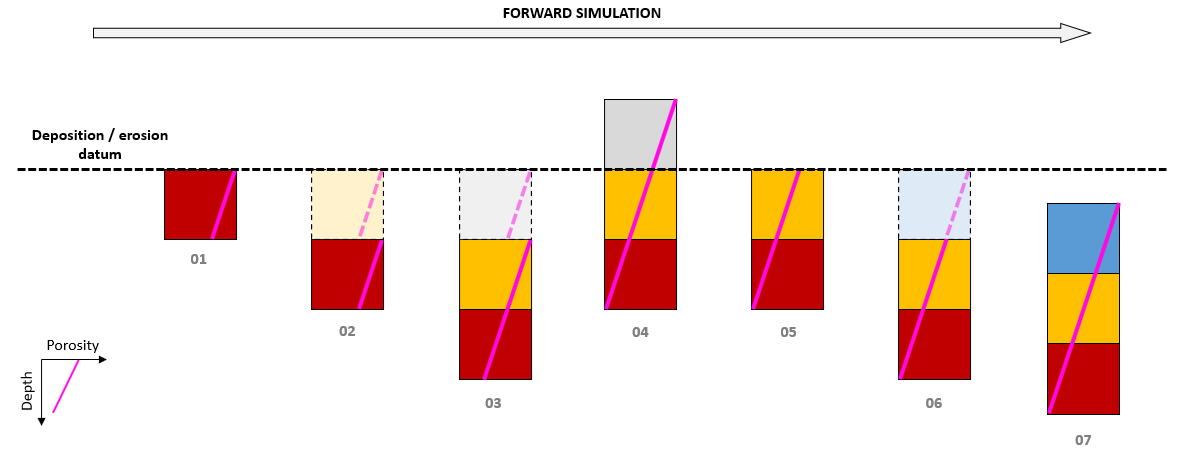
Schematic of porosity distribution in the different formations during forward simulation. The pink line represents a linear compaction curve.
In the figure below the restoration sequence is illustrated. The required decompaction assumptions in order to maximize consistency in formation thicknesses between restoration and forward simulation are therefore:
oThe blue formation is deposited after the erosion of the grey formation. Consequently during restoration the blue formation will be back-stripped to the erosion datum before reconstructing the "uplift / exposure" state of the grey formation. Thus the appropriate decompaction assumptions during back-stripping of the blue formation is to use Decompaction_type "Continuous" within Restoration_data (state 06) so that the yellow formation is not decompacted to the depositional state.
oThen blue formation is removed and the yellow will be back-stripped to re-create the state of uplift of the grey formation (state 05 & 04). During this step the Decompaction_type should be set to "None" so that the porosities in the yellow and red formations do not increase and therefore are consistent with porosities values below an uplifted formation (grey formation not present in restoration).
oIn the subsequent stage the accommodation space for the grey formation will be created (state 03). When the grey formation is deposited the yellow and red formations should be in a normal compaction state (assuming the simplest case of hydrostatic assumptions during the forward simulation). Hence the Decompaction_type should be set to "Continuous".
oIn the following stages we proceed as usual and the Decompaction_type should be set to "Top_layer". For example in subsequent stage the yellow formation is back-stripped to simulate the state when the yellow formation is deposited (state 02) prior to which the red formation should be also in normal compaction state (with porosities reaching the depositional value at the top of the red layer).
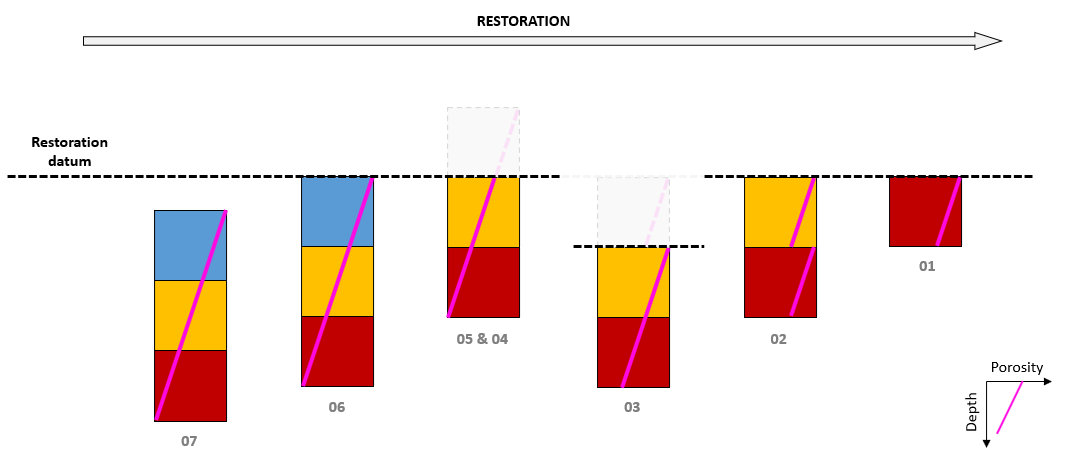
Schematic of porosity distribution in the different formations due to different decompaction assumptions during restoration. The pink line represents a linear compaction curve. The states are numbered backward to facilitate reference with the forward simulation figure.
Because accounting for an eroded formation within the restoration - forward simulation workflow only requires special data being defined during restoration and forward simulation, only those workflow steps will be discussed in the present tutorial case. Nonetheless all the files for all workflow steps is provided. The present case considers distribution of facies as well as usage of membrane elements with couple freedoms on boundary nodes during restoration, hence the non-discussed workflow steps will be identical to those in Case02.
Note that two versions of the present case are provided with the only difference being the mesh discretization / element size (see figure below):
1.A coarse mesh version with a mesh discretization identical to Case02 . This is useful to allow running the model in a reasonable time. However the results at the end of the forward simulation may provide anomalies which may be attributed to a too-coarse mesh (e.g. pore pressure hot spots).
2.A finer mesh version with a mesh discretization similar to Geol_002 Case03a . The results discussed here will be obtained from this case unless specifically stated.
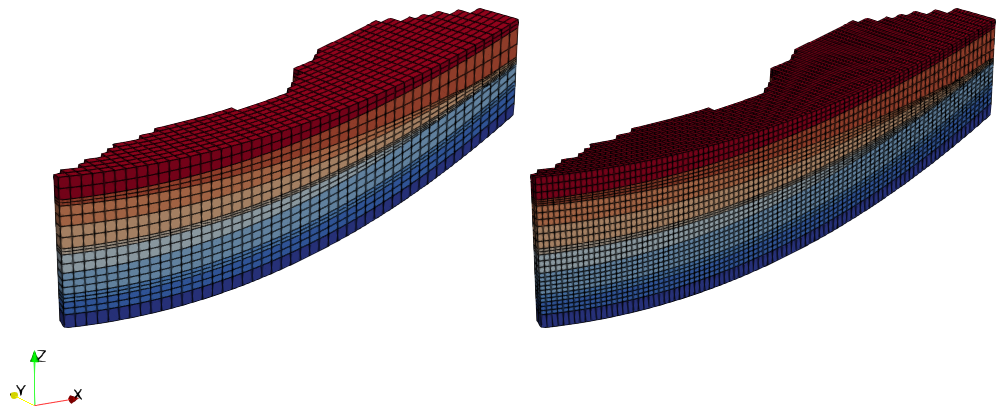
Comparison of the two mesh discretizations provided
