Case01 SR4 Hardening Calibration Introduction
This tutorial example aims to illustrate the effect of the hardening law and poroelastic parameters on the sediment normal compaction curve and provide some guidelines on how to perform a calibration for application to forward geomechanical modelling over geological time scales.
| Introduction |
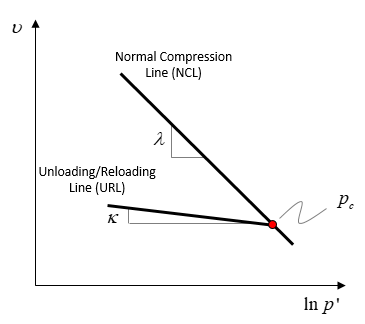
As explained in the Overview of the SR4 Model the hardening law controls the evolution of the pre-consolidation pressure and tensile intercept (which are positively correlated with the size of the yield surface and hence the strength of the material) as a function of the plastic volumetric strain. The two independent input parameters are the hardening modulus (Lambda,
Schematic of hardening law parameters
Being the hardening law equations expressed as follows:
Where:
Therefore Lambda will be the primary parameter controlling the sediment compressibility whereas kappa will define the amount of recoverable porosity (in addition to define the evolution of the Bulk modulus and Young modulus as defined by the poroelastic equation).
Note that the SR4 poroelastic equation is expressed as follows:
Where:
|
| Calibration to data |
The spreadsheet Mat_001b - Analytical hardening.xlsx provided with this example is a useful tool to calculate the expected simulated normal compaction trend for given input parameters. To illustrate how the spreadsheet may be used a calibration to a compaction trend for Gulf of Mexico sediments provided by Hudec et al. (2009) is demonstrated. The spread necessitates input of:
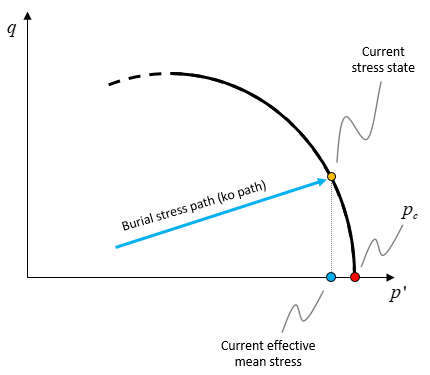
1.Reference values for pre-consolidation pressure, tensile intercept and porosity required by the hardening law. 2.Fluid and grain densities used to calculate the vertical effective stress. 3.Grain stiffness is used to evaluate the Biot constant which will allow to derive a porosity - Biot constant law. 4.All hardening, poroelastic and elastic parameters. 5.Two constitutive parameters for the current material characterisation: a.The K coefficient defined as the horizontal to vertical effective stress ratio b.The mean stress correction which is a factor that multiplies the burial effective mean stress to be able to calculate a guess on the pre-consolidation pressure used by the spreadsheet (see the in the plot below that under burial conditions the pre-consolidation is always larger that the effective mean stress)
Schematic of the relationship between the pre-consolidation pressure and the current effective mean stress during burial conditions
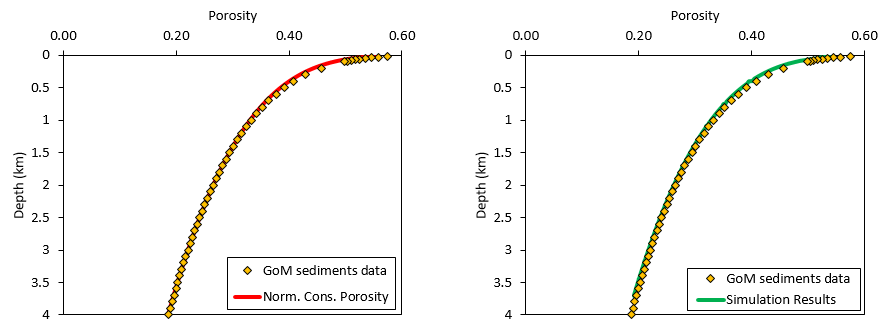
In Fig4 from Hudec et al. (2009) a density trend is provided from which a porosity trend is calculated to use as the basis for calibration. The simulation will be performed. The SR4 yield surface and flow potential shape parameters are defined to be consistent with Kimmeridge clay characterisation (will be demonstrated in Mat_002 example). Most of the parameters are assumed whereas reference porosity (surface porosity) and Lambda are calibrated against the data. All input values are summarized in the following table:
Note that both the effective stress ratio and the mean stress correction will largely depend on the shape of the yield surface and flow potential so they can be determined from an initial simulation which may consist either of an oedometer test or in a column burial model.
The model used to demonstrate the calibration is a column burial model which considers a pre-existing geometry with three initial layers of the characterised material that are initialized with gravity. After initialization 9 additional formations of the same material are deposited. The simulations are run under hydrostatic conditions. In the figure below it can be seen the calibration performed in the spreadsheet (left) and the results after simulation (right). As can be seen both provide a reasonably good match with the data.
Calibrated compaction trend to Hudec et al. (2009) data for Gulf of Mexico sediments. Spreadsheet calibration (left). Simulation results (right).
|
| Sensitivity analysis of the hardening parameters |
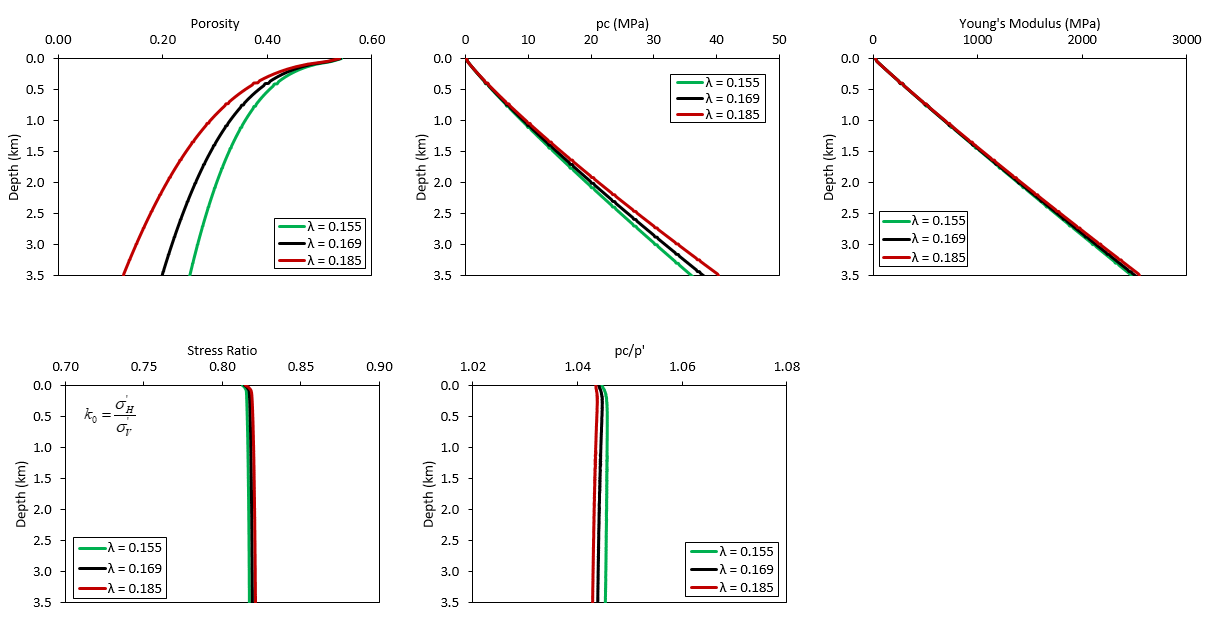
In order to provide a better understanding of the effect of the different hardening and poroelastic parameters on the results a sensitivity analysis is provided. All non-investigated parameters for each case are kept equal to the previous material characterisation fitting Hudec's et al. (2009) data. In all the plots the black curve corresponds to such base case.
Effect of the hardening modulus From the figures below it can be seen that:
1.As expected Lambda has a large influence in porosity as it controls the amount of plastic volume strain upon a given effective mean stress. An increase in Lambda's value leads to an increase in compaction and vice-versa.
2.As lambda is increased the pre-consolidation pressure also increases. This is because as lambda increases the plastic volume strain also increases leading to an increase in pc (see above the hardening law equation for pre-consolidation pressure which depends on plastic volume strain).
3.The effect on Young's modulus, stress ratio and pc'/p' ratio (mean stress correction) is negligible.
Results for different values of the hardening modulus
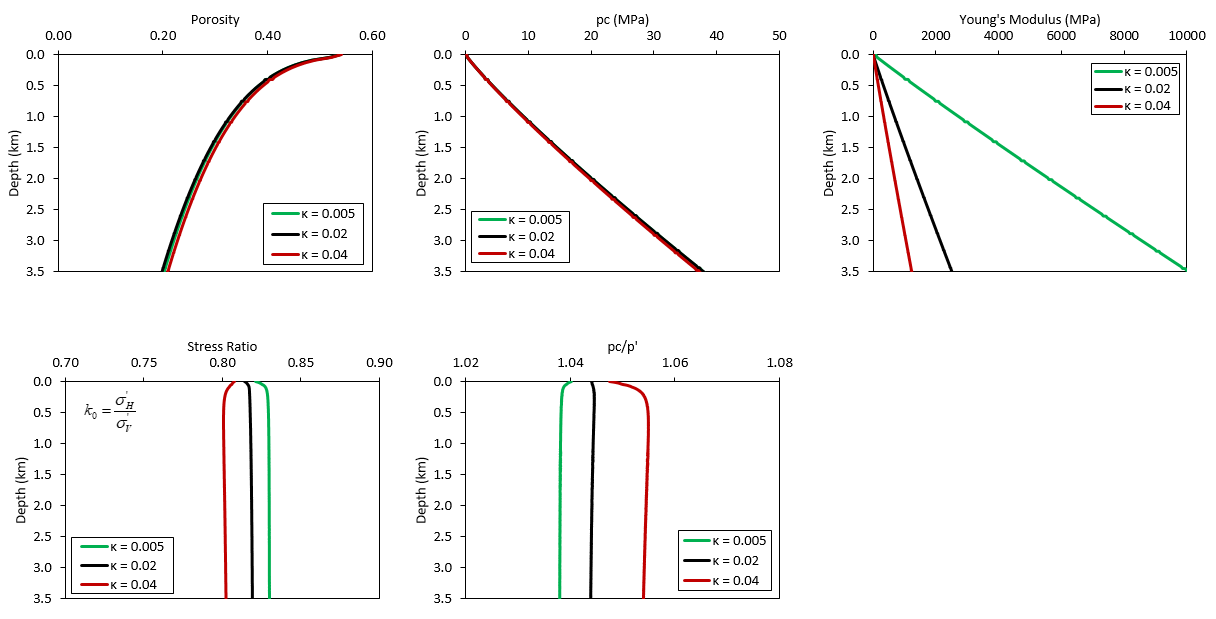
Effect of kappa In the figures below the effect of kappa on the results is illustrated. It can be seen that:
1.The effect of kappa in porosity and pre-consolidation pressure is rather small for the set of tested parameters.
2.As expected kappa has a large effect in Young's modulus with lower values of kappa resulting in larger Young's modulus values (stiffer sediments).
3.Although the shape of yield surface and flow potential are expected to be the primary controls on stress ratio and the relationship between pre-consolidation pressure and effective mean stress under uniaxial burial conditions, kappa has some degree of influence in such parameters.
Results for different values of kappa
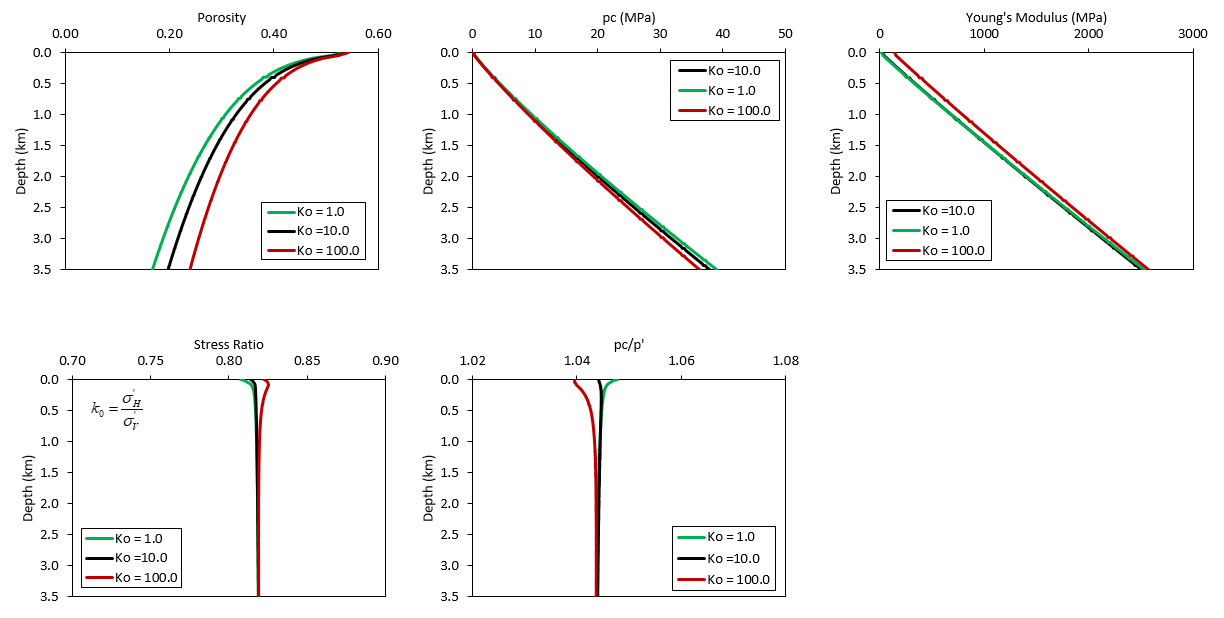
Effect of the reference bulk modulus Note that accounting for a reference bulk modulus in the poroelastic equation is a convention adopted in order to avoid extremely low stiffness at surface. For field scale simulations over geological time frames it should be set to 10.0 MPa.
In the figures the effect of changing the value of the reference Bulk modulus on the results is illustrated. It can be seen that:
1.As expected larger values of the reference bulk modulus results in larger values of Young's modulus. The difference between the three cases is larger at shallow depths where the reference bulk modulus value has proportionally a larger contribution in the computed bulk modulus value.
2.Larger values of Reference bulk modulus result in higher porosities as there will be less elastic volume reduction (due to the higher stiffness).
3.The larger porosities for the large reference bulk modulus case result in lower integrated stresses and hence in less plastic compaction and less pre-consolidation pressure.
Results for different values of the reference bulk modulus
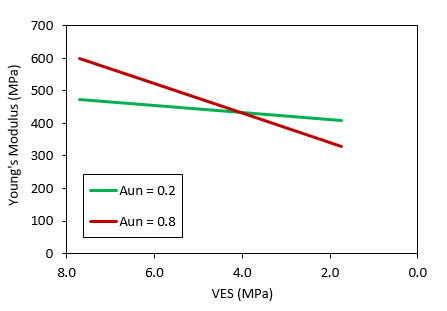
Effect of the poroelastic dependence factor The relative contribution of pre-consolidation pressure and effective mean stress in the bulk modulus value is controlled by the Aun parameter. In order to show its effect in the results an erosion period which removes the two top-most formations is considered. The evolution of the Young's modulus as a function of the vertical effective stress for a point close to the new top surface after erosion is shown below. Note that such point experienced some softening due to the large decrease in stresses during erosion but only the elastic path is considered in the plot. As can be seen large values of Aun factor result in a much larger reduction in Young's modulus. It should be noted that for Cam Clay poroelasticity (Aun = 1) the reduction in Young's modulus upon erosion may be too large (it is expected that if a thick layer of sediment is eroded, the sediment below will retain most of its stiffness achieved due to consolidation). Hence accounting for the contribution of the pre-consolidation pressure in the bulk modulus is recommended for field scale forward geomechanical modeling over geological time scale.
Evolution of Young's modulus during unloading due to erosion for different values of the poroelastic dependence factor
|
| Key points and other considerations for field scale simulations over geological time scales |
1.It should be noted that the hardening curve (and hence compaction curve) depends largely on the reference values for pc and porosity. In order to maintain a consistent compaction curve if one of these values is changed at some point the other should be changed accordingly.
2.The reference value for pc adopted in the present example has been -0.1 MPa which is the lower bound of the recommended values. In some evolutionary field scale simulations it may be required to use a higher value in order to prevent plastic flow in the near-surface sediments (e.g. to improve top surface stability for a top surface with relief).
3.In coupled simulations a top surface load is usually applied in order to prevent the stresses to become tensional (positive) upon a pore pressure increase (such thing would cause an instability). If a top surface load of 1.0 MPa is applied for example a common practice is to set the reference pc accordingly to -1.0 MPa so that the top 100 m of the model are effectively modeled as a load (at 100 m depth the VES is around 1.0 MPa which is the load applied with consistent pc and porosity values).
4.It is recommended to always use a reference bulk modulus of 10 MPa and use the poroelastic model type 2 accounting for the contribution of pc in the bulk modulus with an Aun parameter value of 0.5.
5.The value of kappa should be calibrated first in order to obtain a desired value of Young's modulus / Bulk modulus at the target depth. Then lambda should be calibrated to predict the target porosity at target depth.
6.The case considered here assumes hydrostatic pore pressures. In presence of overpressure it is recommended to perform the calibration in terms of porosity vs. vertical effective stress rather than porosity vs depth.
7.For the case considered the Porous_flow_type is set to 5 which calculates the vertical effective stress based on the effective density calculated as ρe = ρg - ρf . Thus Biot's constant is considered 1.0 which is consistent with the set up of the spreadsheet. Nonetheless in the spreadsheet an evaluation of the Biot's constant is provided which is calculated as α = 1 - K/Kg where K and Kg are the bulk and grain stiffness respectively. This evaluation can be used to define Biot's constant as a function of porosity in the material data file. Then the sheet "Analytical Hardening (Biot)" which accounts for the evaluated Biot's constant value for calculating the vertical effective stress may be used instead.
8.Data for calibration of the yield surface envelope and flow potential is usually scarce. It is thus generally recommended to use default values in most cases which should provide a reasonable friction angle which may be lithology dependent. If the aim is to characterize a clay or shale the parameters defining SR4 yield and flow surfaces may be defined consistent with the Kimmeridge Clay characterization provided in the example Mat_002 Case 1. In a similar manner for sands and sandstones parameters for Berea sandstone may be used (see Mat_002 Case2 which provides data from Wong et al (1997) to define the yield envelope).
|
References
Hudec, M.R., Jackson, M.P.A. & Schultz-Ela, D.D. (2009). The paradox of minibasin subsidence into salt: Clues to the evolution of crustal basins. Geological Society of America Bulletin. 121, pp. 201-221.
Wong, T.-F., Christian, D., & Wenlu, Z. (1997). The transition from brittle faulting to cataclastic flow in porous sandstones: Mechanical deformation. Journal of Geophysical Research, 102(B2), 3009–3025
|

