In this case an exercise to perform a material calibration for Berea sandstone history is proposed. The work flow would be similar to that shown in Case1 for Kimmeridge clay namely:
1.Initially calibrate mechanical compaction response of a lithic sand
2.Calibrate a single diagenesis reaction that captures the transition from a lithic sand properties to the litified Berea sandstone properties during Berea Sandstone burial history.
The initial datafile and data for calibration is provided in Mat_002\Case2\Data. Look for text in the material data file and follow the instructions.
Data and assumptions overview
The data used to perform the calibration comprises:
1.Berea sandstone Yield surface envelope, present day porosity and grain size from Wong et al. (1997)
2.Berea sandstone burial history derived from Charpentier (1987).
3.Lithic sand experimental mechanical compaction trend from Chuhan et al. (2003).
In Wong et al. (1997)Berea sandstone data is reported. The grain diameter is 0.26 mm and the present day porosity is 0.21. Also yield envelope points with distinction of yield by shear enhanced compaction and yield by shear failure are provided. As can be seen from the yield surface envelope points Berea sandstone is a considerably strong sandstone with a pre-consolidation pressure close to 400 MPa. These points can be used to define the yield surface parameters and the strength at the end of the burial history. Note that in the spreadsheet Mat_002_Case2_Template.xlsx a sheet to facilitate calibration of the yield surface is provided.
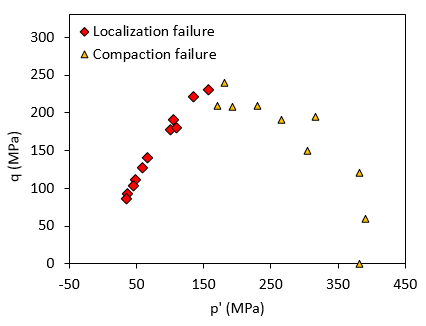
Berea sandstone yield envelope points. Obtained from Wong et al. (1997)
Chuhan et. al. (2003) published experimental compaction curves for several loose sands with different grain sizes and compositions under oedometer conditions (k0 path). A curve from this data set may be used to calibrate the mechanical compaction parameters for Berea sandstone. The curve for a lithic sand with a grain size diameter of 0.37 mm will be used for that purpose.
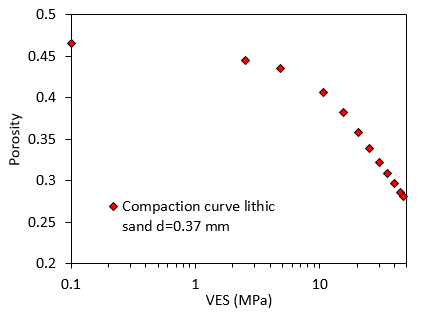
Oedometer compaction trend for a lithic sand with grain diameter of d=0.37 mm. Obtained from Chuhan et al. (2003)
Such compaction trend may be approximated to a porosity - depth curve by assuming a lithostatic gradient of 0.022 MPa/m and hydrostattic pressures with an hydrostatic gradient of 0.01 MPa/m. If a point is defined considering the maximum burial depth of Berea sandstone and its current day porosity it can be seen that there is a considerable difference in porosity with the mechanical compaction trend for the lithic sand (a porosity difference of 0.148). Hence it can be assumed that such porosity difference may be attributed to non-mechanical processes.
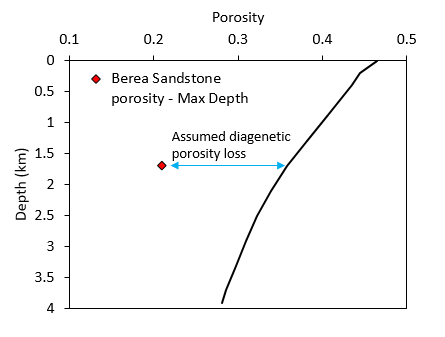
Comparison of a point defined by Berea sandstone maximum burial depth and its current day porosity with the mechanical compaction trend for the lithic sand from Chuhan et al. (2003)
In Charpentier (1987) the burial history for the different strata ages in Michigan basin is provided. Berea sandstone is late Devonian - Mississippian in age (c.a. 350 Ma) so the burial history curve below is derived from Charpentier's plot. Note that the temperature and vertical effective stress points are approximations derived by:
1.Assuming a surface temperature of 20 oC and a temperature gradient of 0.035 oC/m
2.Integration of densities for the lithic sand compaction trend assuming a grain density of 2650 Kg/m3 and a water density of 1000 Kg/m3
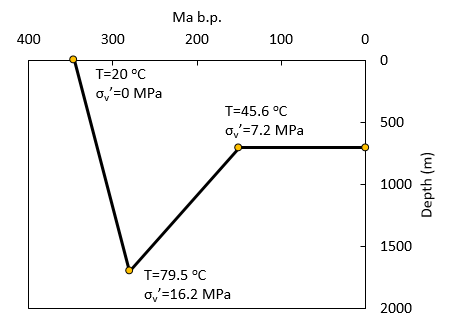
Burial history for Berea sandstone
Objectives description
The specific objectives in this tutorial exercise are the following:
1.Case2a: Develop a single element test and calibrate a mechanical compaction only constitutive model for Berea sand that can capture the experimental curve provided by Chuhan et al. (2003). The yield envelope data may be used to define the shape of the yield surface and the critical state angle.
2.Case2b: Develop a single element test that will be used to simulate burial history conditions for Berea sandstone and calibrate a diagenesis reaction that will help to predict the observed present day porosity and strength at the end of the burial history.
Note that data file set up is very similar to that of Case1 and hence only description to the most relevant features is provided.
| Case2a: Oedometer test for lithic sand |
Problem Description
The model considers a single axi-symmetric element to simulate an odometer test. Perpendicular displacements are fixed at base, axis of symmetry and side. A surface load is applied on the top. A time curve will be used to apply load and unload during the simulation.
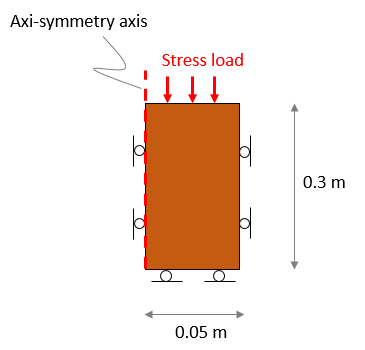
Geometry of the model
| Basic set up file description |
The initial data file for the project is: Mat_002\Case1\Data\Mat_002_Case2a.dat and theMat_002_Case2a.mat. Look for text in the material datafile and follow the instructions.
The basic data includes:
1A single group which is assigned the "Berea_sandstone" properties defined using Group_control_data and Group_data data structures. The Porous_flow_type = 1 (i.e. a zero pore pressure porous material). 2Material properties (Material_data) for "Berea_sandstone". 3Global damping (Damping_global_data) for the geomechanical field with 2% percentage damping (see Mech_002). 4One Global_loads case to apply the stress load with an associated Time_curve_data that will be used to define the loading and unloading stages. 5Support_data defining perpendicular displacement fixities for lines 1, 2 and 4 . 6A History_point to output the history results to plot them in excel. 7Mesh_control_data and a Structured_mesh_data defining a single element (1 division). 8 Control_data for a single stage.
|
The material data is defined in a separate file named "Mat_002_Case2a.mat". In this file there are some properties left in blank that the user must fill in. Look for text in the material datafile and follow the instructions. It is recommended for the user to perform the calibration without looking at the solution provided here.
The material considered is poro-elasto-plastic. Only the relevant material data is discussed here (note that in the actual material datafile additional data such as porosity permeability curve is defined).
The yield surface data from Wong et al. (1997) is used to define the yield surface and flow potential parameters. Even though the current simulation considers the calibration of the mechanical compaction behaviour for a lithic sand, the yield surface shape must be consistent with that of Berea sandstone. The yield surface and flow potential shown in the figure below provide a good fit with the data. Note that:
1.The yield surface agrees well with the yield points on the shear side which seem to define a clear yield envelope. 2.On the compression side the data is more sparse and the suggested yield surface captures the average of the points. 3.The flow potential is defined such that is flatter than the yield surface and the critical state is located such that it separates the yield points in compression and shear. 4.The calibrated yield surface considers a pc=380 MPa and a pt=-7 MPa. However it should be noted that the reference values for the lithic sand will be lower than those as there is a contribution from diagenesis to achieve such relatively high strength.
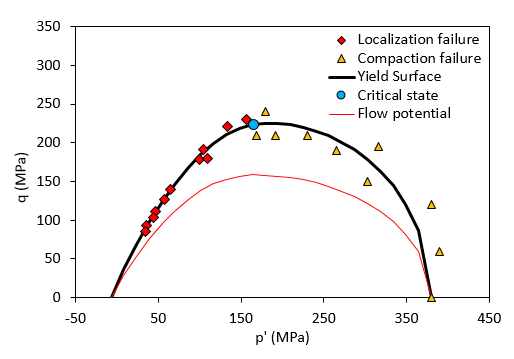
Calibrated yield surface shape according to data from Wong et al. (1997)
Data File
|
|
* Material_data
Name "Berea_Sandstone"
Grain_stiffness 20000.0
Grain_density 2650.0
Porosity_model_type 1
Porosity 0.465
Elastic_model_type 1
Elastic_properties IDM=2
10000.0
0.25
! -------------------------------------------------------------
Porous_elasticity_type 2
Porous_elastic_properties IDM=3
10.0
0.08
0.5
Plastic_material_type 2
Plastic_properties IDM=9
0.3
-6.9
67.5
62.5
0.60
0.60
0.25
0.95
0.8
Hardening_Type 3
Hardening_properties IDM=4 JDM=1
0
0.180
-0.069
0.003
Regularisation_type 1
Regularisation_properties IDM=4
1.0
0.0
0.6
100.0
|
1.In the Data File example on the left the calibrated values for the properties left in blank in the material data file are shown in bold:
a.A reference porosity of 0.465 is set in order to match the mechanical compaction data from Chuhan et al. (2003).
b.The yield surface shape parameters for the p' - q plane (friction parameter, dilation parameter and exponents n and m) have been chosen to match the yield data from Wong et al. (1997) as shown in the figure above. Note that to fit the data a high pc and pt are required as discussed above.
c.Reference pc is set to -6.9 MPa to fit the data from Chuhan et al. (2003). It is assumed that the marked change in slope shown in the data points is due to the transition from elastic to plastic behaviour.
d.Reference pt is set to 0.3 MPa assuming that the diagenesis has contributed to the cementation enhancing pt to the value required to fit the yield data from Wong et al. (1997).
e.Residual pc and residual pt have been set to be 100 times lower than their respective reference values.
f.Lambda and Kappa have been set to fit the compaction data from Chuhan et al. (2003).
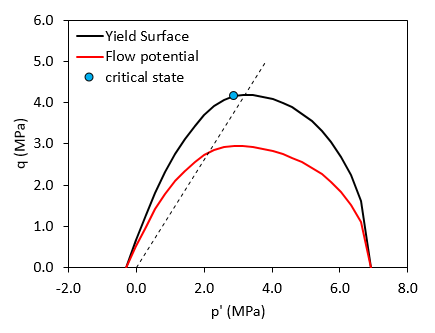
Reference Yield surface and flow potential in the p'-q space
|
|
Results for this example are in Mat_002\Case2\Results. History results are output to file Mat_002_Case2a.hdh and can be plotted in the Mat_002_Case2.xlsx excel sheet.
As can be seen the chosen parameters provide a reasonable good fit with the data from Chuhan et al. (2003).
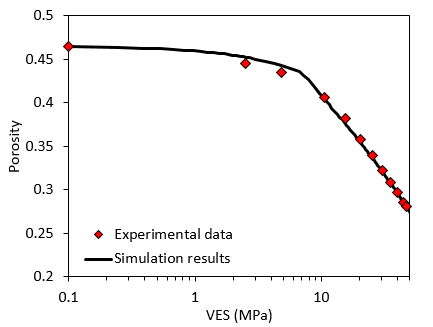
Results for Berea sandstone compaction calibration
|
|
| Case2b: Berea sandstone burial history |
Problem Description
A single axi-symmetric element will be considered to simulate a representative volume of Berea sandstone during its burial history. Perpendicular displacements are fixed at base, axis of symmetry and side. A surface load is applied on the top representing the overburden weight during Berea sandstone burial history. A time curve will be used to apply the appropriate load during the simulation. Temperature is prescribed at the whole surface. The appropriate temperature value during burial history is prescribed using a time curve.
In Charpentier (1987) the burial history for the Michigan basin is provided. The temperature data points shown in the figure below are estimations made by assuming a surface temperature of 20 ºC and a temperature gradient of 0.035 ºC/m. The stress point data is derived by integrating densities on the compaction curve shown in the third figure from the current manual page. Note that a maximum temperature of 79.5 ºC is reached at maximum burial rate. Despite quartz cementation and chemical compaction in sandstones is believed to occur at temperatures above 80 ºC (e.g. Bjørlykke et al. 2008, Walderhaug & Bjørkum, 2003) it has been recently suggested that quartz cementation might start at temperatures between 60 ºC and 70 ºC (Harwood et al., 2013). For the present case a threshold temperature of 70 ºC for the diagenetic reaction is assumed.
The aim of this exercise is to assign and calibration of a diagenetic reaction to predict a present day porosity of 0.21, a pre-consolidation pressure of 380 MPa and a tensile intercept of 7 MPa after simulation of Berea sandstone burial history.
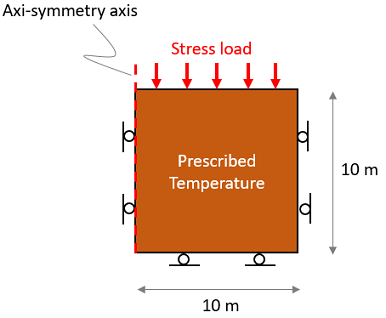 
Geometry of the model (left) and Berea sandstone burial history (right)
| Basic set up file description |
The initial data file for the project is: Mat_002\Case1\Data\Mat_002_Case2b.dat and theMat_002_Case2b.mat. Look for text in the material datafile and follow the instructions.
The basic data includes:
1A single group which is assigned the "Berea_sandstone" properties defined using Group_control_data and Group_data data structures. The Porous_flow_type = 1 (i.e. a zero pore pressure porous material). 2Material properties (Material_data) for "Berea_sandstone". 3Diagenesis_data to capture a predicted present day porosity of 0.21, a pre-consolidation pressure of 380 MPa and a tensile intercept of 7 MPa after simulation of Berea sandstone burial history. 4Global damping (Damping_global_data) for the geomechanical field with 2% percentage damping (see Mech_002). 5Two Global_loads case with their corresponding Time_curve_data that will be used to: a. Define stress load during burial history b.Define temperature evolution during burial history 6Support_data defining perpendicular displacement fixities for lines 1, 2 and 4 . 7A History_point) to output the history results to plot them in excel. 8Mesh_control_data and a Structured_mesh_data defining a single element (1 division). 9 Control_data for a single stage.
|
The previous calibrated material data properties in Case2a are used. In here only the diagenetic properties and the assignment of the diagenetic properties are discussed.
Data File
|
|
* Material_data
Name "Berea_sandstone"
(...)
Diagenesis_reaction_names IDM=1
"Berea_Sandstone"
(...)
* Diagenesis_data
Name "Berea_Sandstone"
Maximum_porosity_change 0.176
Compaction_direction_factor 0.0
Reaction_model_name "Power"
Reaction_properties IDM=4
0.24
1.0
70.0
1.0
Cementation_model_name "Enhanced_pt"
Cementation_properties IDM=1
6.7
Compaction_model_name"Enhanced_pc"
Compaction_properties IDM=1
0.97
|
1.In Material_data the diagenesis reaction that will be considered is assigned via Diagenesis_reaction_names. Note that more than 1 diagenetic reaction may be assigned to any material.
2.In the Data File example on the left the calibrated values for the properties left in blank in the material data file are shown in bold:
a.The maximum porosity change for this reaction is calibrated to 0.176 (17.6 % of porosity can be lost due to this diagenetic reaction).
b.The Compaction_direction_factor defines whether the reaction is uniaxial (0.0) or isotropic (1.0). This parameter was already assumed.
c.The initiation temperature and the exponent were already provided. The parameter left for calibration was the pre-factor constant (which controls the kinetics of the reaction). A value of 0.24 is set in order to complete the reaction in the time frame the considered volume of rock is above 79.5 ºC.
d.The increment in pt is set to 6.7 MPa so that after the diagenetic reaction is complete the tensile intercept will increase from 0.3 MPa to 7 MPa due to cementation as required to fit the yield data from Wong et al. (1997).
e.Contrasting with Case1 the selected compaction model is "Enhanced_pc". In this model variation in pc due to diagenesis is considered whereas variation in Lambda and Kappa is not accounted for. Note that this model has been chosen as data for determination of the diagenetically modified lambda an kappa is not available.
f.The factor of porosity change defines the factor of the diagenetic volumetric strain contributing to increase in strength (increase in pc). This value has been calibrated to 0.97 so that at the end of the burial history simulation the predicted pc is c.a. 380 MPa as required to fit the yield data from Wong et al. (1997).
|
|
Results for this example are in Mat_002\Case2\Results. History results are output to file Mat_002_Case2b.hdh and can be plotted in the Mat_002_Case2.xlsx excel sheet.
The figure below shows the porosity-depth path during burial history. As can be seen the calibrated diagenesis reaction enabled to predict a porosity of 0.21 at present day with the porosity-depth path terminating approximately at the present day data.
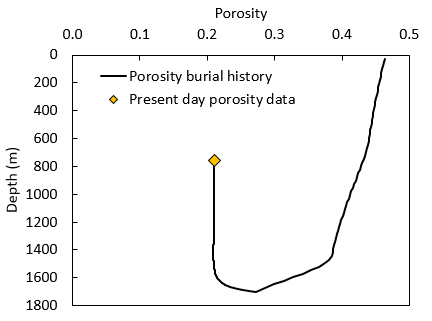
Porosity-depth path during burial history from deposition to a present day depth of c.a. 750 m
The figures below show the evolution of some properties during burial history. The picture on the left shows the evolution of porosity and the diagenetic porosity loss. As can be seen the porosity at present day is 0.21. Note that the diagenetic porosity loss has taken place from 290 Ma b.p. to 244 Ma b.p. (a time frame of 46 Ma) when the temperature exceeded the threshold temperature of 70 ºC. The picture on the right shows the evolution of the pre-consolidation pressure and the tensile intercept. The predicted present day values have been 379.3 MPa and 6.9 MPa respectively which are a reasonably good match to the target values of 380 MPa and 7 MPa respectively required to fit the yield data points from Wong et al. (1997).
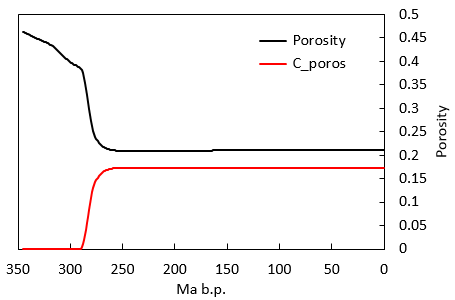 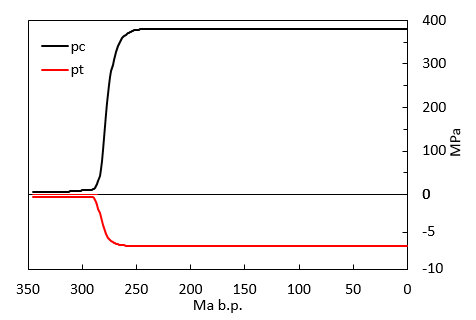
Evolution of material properties with time.
|
|
Bjørlykke, K., Jahren, J., Mondol, N. H., Marcussen, O., Croize, D., Peltonen, C., & Thyberg, B. (2008). Sediment compaction and rock properties. In AAPG International Conference and Exhibition (pp. 1–8). Cape Town, South Africa.
Charpentier, R. R. (1987). A summary of petroleum plays and characteristics of the Michigan basin. Reston, VA: US Geological Survey.
Chuhan, F. A., Kjeldstad, A., Bjørlykke, K., & Høeg, K. (2003). Experimental compression of loose sands; relevance to porosity reduction during burial in sedimentary basins. Canadian Geotechnical Journal, 40, 995–1011.
Obradors-Prats, J., Rouainia, M., Aplin, A. C. and Crook, J. L. (2019) A diagenesis model for geomechanical simulations: formulation and implications for pore pressure and development of geological structures. Journal of Geophysical Research: Solid Eath. Vol 124 (5) pp. 4452-4472.
Harwood, J., Aplin, A. C., Fialips, C. I., Iliffe, J. E., Kozdon, R., Ushikubo, T., & Valley, J. W. (2013). Quartz cementation history of sandstones revealed by high-resolution SIMS oxygen isotope analysis. Journal of Sedimentary Research, 83, 522–530.
Walderhaug, O., & Bjørkum, P. A. (2003). The effect of stylolite spacing on quartz cementation in the lower Jurassic Sto formation, southern Barents Sea. Journal of Sedimentary Research, 73(2), 146–156.
Wong, T.-F., Christian, D., & Wenlu, Z. (1997). The transition from brittle faulting to cataclastic flow in porous sandstones: Mechanical deformation. Journal of Geophysical Research, 102(B2), 3009–3025.
|


