Kimmeridge clay is probably one of the best documented examples on effects of diagenesis on sediment geomechanical properties thanks to the work published in Nygård et al. 2004a, 2004b and 2006. In this tutorial the aim is thus to use that data to calibrate a diagenesis model.
Kimmeridge Clay data overview
In Nygård et al. 2004a and 2004b two sets of samples of Kimmeridge clay are described. The first set consist in samples collected at shallow depths (a maximum depth of c.a. 500 m) where no diagenesis overprint on sediments is assumed. These samples will thereafter be referred to as Kimmeridge Westbury Clay (KWC). The second set of samples were collected at greater depths (maximum of c.a. 1.9 Km) in which the burial history indicates that the sediments have been exposed to temperatures of up to 80ºC and maximum stress of 20 MPa. These samples will thereafter be referred to as Kimmeridge Bay Clay (KBC). The parent materials of these samples are expected to be the same, however the present day porosities and geomechanical properties of the two samples are very different. See for example the geomechanical tests in the figures below. It can be observed that:
1.The two samples have very different porosities at 0.1 MPa. KWC is around 0.52 whereas KBC is about 0.22.
2.The two samples have a very different compressibility (e.g. slope of the compression line).
3.The two samples have very different elastic properties (i.e. see the slope of the unloading path for KWC compared to the slope of KBC compression path at stresses below 20 MPa, which is the over consolidated path given that is considered the maximum stress to which KBC was exposed to during its burial history)
4.The two samples have very different porosities at 20 MPa which is the maximum stress to which KBC was exposed to during its burial history. Thus the difference is attributed to non-mechanical compaction.
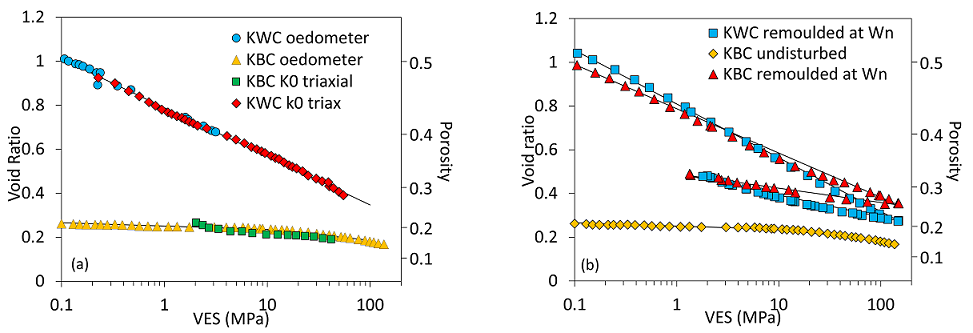
Geomechanical tests for KWC and KBC. Figures as published in Obradors-Prats et al. (2019) which obtained the data from Nygård et al. 2004a.
Objectives description
The specific objectives in this tutorial are the following:
1.Case1a: Develop a single element test and calibrate a mechanical compaction only constitutive model for KWC that can capture the behaviour observed in geomechanical experiments.
2.Case1b: Develop a single element test that will be used to simulate burial history conditions for KBC and calibrate a diagenesis reaction that will help to capture the change in geomechanical behaviour from KWC to KBC properties.
| Case1a: Oedometer test for KWC |
Problem Description
The model considers a single axi-symmetric element to simulate an odometer test. Perpendicular displacements are fixed at base, axis of symmetry and side. A surface load is applied on the top. A time curve will be used to apply load and unload during the simulation.
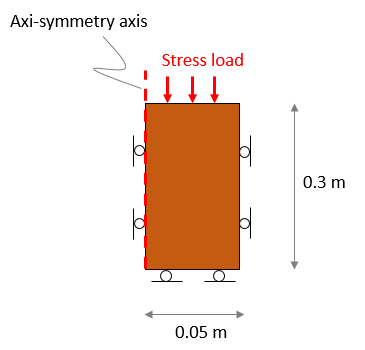
Geometry of the model
| Basic set up file description |
The initial data file for the project is: Mat_002\Case1\Data\Mat_002_Case1a.dat and the Mat_002_Case1a.mat. The basic data includes:
1A single group which is assigned the "KWC" properties defined using Group_control_data and Group_data data structures. The Porous_flow_type = 1 (i.e. a zero pore pressure porous material). 2Material properties (Material_data) for "KWC". 3Time scaling data (Time_scaling_data) with target time step 1E-4s (see Mech_002). 4Global damping (Damping_global_data) for the geomechanical field with 2% percentage damping (see Mech_002). 5One Global_loads case to apply the stress load with an associated Time_curve_data that will be used to define the loading and unloading stages. 6Support_data defining perpendicular displacement fixities for lines 1, 2 and 4 . 7A History_point) to output the history results to plot them in excel. 8Mesh_control_data and a Structured_mesh_data defining a single element (1 division). 9 Control_data for a single stage.
|
Data File
|
|
* Group_control_data
Group_numbers IDM=1
1
Active_geomechanical_groups IDM=1
1
* Group_data NUM=1
Group_name "KWC"
Element_type_number 9
Material_name "KWC"
Surfaces IDM=1
1
Porous_flow_type 1
|
1.A single group is defined with geomechanical field active 2.Group name is "KWC" 3.Element type is Axi-symmetric (Element_type_number = 9) 4.Assigned material is KWC. 5.Group is assigned to the only surface defined 6.Group is defined dry porous (Porous_flow_type = 1) |
|
The material data is defined in a separate file named "Mat_002_Case1a.mat". The material considered is poro-elasto-plastic. The minimal material data required to run the simulation is shown here (note that in the actual material datafile additional data is defined).
For the yield surface definition undrained stress path data from Nygård et al. (2006) is taken into account. As the aim is to define a shape that is common for KWC and KBC (only difference will be its size) stress data for both set of samples is taken into account. Assumptions are:
1.KWC is assumed to be normally consolidated. Therefore undrained stress paths on KWC samples are assumed to start at the pc value of the test and approximately travel following the cap side of the yield surface towards the critical state line where they terminate.
2.KBC is assumed to be over consolidated due to diagenetic hardening. Therefore undrained stress paths performed at relatively low confining pressure (relative to the pc of the KBC) are assumed to have a deviatoric stress peak that should meet the yield surface on the shear side and then cause softening. To determine the pc value of KBC the compression plots should be taken into account (pc value is where approximately the compression curve changes in slope). This value can be calibrated during diagenesis law calibration.
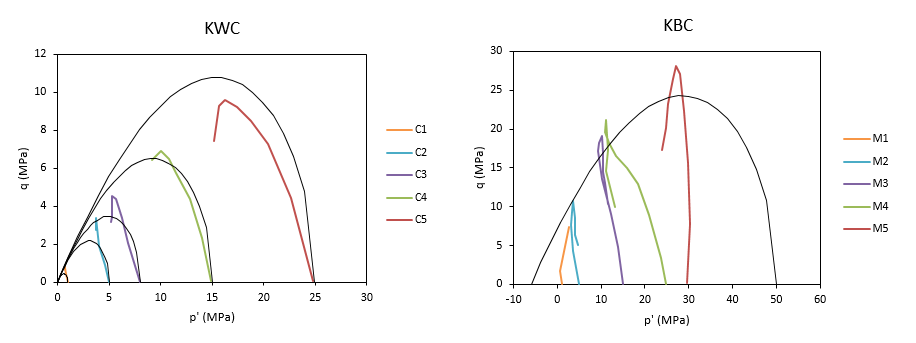
Calibrated yield surface shape compared to undrained stress paths for KWC and KBC
Data File
|
|
* Material_data
Name "KWC"
Grain_stiffness 20000.0
Grain_density 2650.0
Porosity_model_type 1
Porosity 0.51050
Elastic_model_type 1
Isotropic_elastic_properties IDM=2
10000.0
0.30000
Porous_elasticity_type 2
Porous_elastic_properties IDM=3
10.0
0.05
0.5
Plastic_material_type 2
Plastic_properties IDM=9
0.01
-0.1
52.0
45.0
0.60
0.60
0.25
1.6
1.6
Hardening_Type 3
Hardening_properties IDM=4 JDM=1
0.00000
0.11000
-0.0010
1.0E-04
Regularisation_type 1
Regularisation_properties IDM=4
0.100
0.000
0.600
100.0
|
1.Material is named KWC. 2.Grain properties are provided. Grain density is set to 2650 Kg/m3 according to the published data. 3.A porosity of 0.5105 is set to fit the data. 4.Reasonable elastic properties for a clay/shale are provided. Poisson ratio is set to 0.3. Note that Young's modulus will be controlled by the poroelastic law. 5.Poroelastic model is set to type 2 (law dependent on both, stress and pc). The following properties are shown: a.Reference bulk modulus of 10 MPa (arbitrary). b.Kappa of 0.05 (calibrated using the unloading path of the mechanical compaction data for KWC). c.Dependence factor of 0.5 6.The SR4 properties are defined according tho the calibrated/assumed yield surface. The values are such that: a.The resulting approximate friction angle for KWC is 18.4º b.Exponent "n" and "m" are equal so the critical state coincides with the peak deviatoric stress of the yield surface. c.Flow potential is flatter that the yield surface. This results in a higher ratio of deviatoric strain to volumetric strain than an associative flow rule.
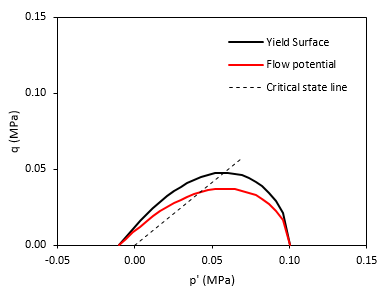
Reference Yield surface and flow potential in the p'-q space
7.Analytical hardening is defined. Note that the diagenesis model implemented in ParaGeo is only compatible with analytical hardening. Values are defined according to: a.Kappa value from poroelastic properties is used if defined so the value in hardening data is set to 0. b.Lambda is calibrated using the KWC mechanical compaction data. c.Residual pc and pt values are set as 0.01 multiplied for the reference values. Note that residual values are used to ensure that yield surface function cal always be calculated. 8.Regularization properties are defined. Note that characteristic length is recommended to be of the order of the element length.
|
|
Data File
|
|
* Support_data
Displacement_codes IDM=3 JDM=4
1 1 0
0 1 0
1 0 0
0 0 0
Displacement_code_lines IDM=3 JDM=2
1 2 4
2 3 3
|
1.Support_data is set defining displacement fixities in normal direction to base, side and axis of symmetry. |
|
Data File
|
|
* Global_loads NUM=2
Surface_load IDM=2 JDM=1
1.0 0.0
Surface_load_type 1
Surface_load_line_pointers IDM=1 JDM=2
3
1
* Time_curve_data NUM=2
Time_curve IDM=7
0.0 0.02 0.5 3.0 3.05 4.5 5.0
Load_factor IDM=7
0.0 0.1 10.0 150.0 150.0 20.0 5.0
* Load_case_control_data
Loadcases IDM=1
2
Active_load_flags IDM=1
2
|
1.A Global_loads data structure is defined to assign an axial stress load to the top line (line 3) of the model. 2.The load is set to 1.0 so that the Load_factor in Time_curve_data is used as a multiplication factor to define the actual stress at each time. 3.The Time_curve_data is defined to apply increment in axial load following a piecewise linear function. The curve is defined so that: a.Maximum stress is 150 MPa according to the published data. b.Enough history outputs to represent state at 0.1 MPa and maximum stress are ensured. c.After reaching maximum stress there is an unloading path to a minimum stress of 5.0 MPa. 4.Load_case_control_data is defining the load case as active. |
|
Data File
|
|
* Mesh_control_data
Generation_algorithm 1
Mesh_generation_flag 0
* Structured_mesh_data
Default_divisions 1
Surfaces IDM=1
1
|
1.A structured mesh is defined in Mesh_control_data (Generation_algorithm = 1). 2.A single division is defined in order to perform a single element simulation. |
|
Data File
|
|
* History_point NUM=1
Name "Set1"
Group 1
Output_frequency_time 0.02
Point_coordinates IDM=2 JDM=1
0.05 0.3
Stresses IDM=6
"STRS_XX" "STRS_YY" "STRS_ZZ" "STRS_XY" "STRS_YZ" "STRS_ZX"
Stress_invariants IDM=5
"PRESS" "EFSTRS" "Strs_11" "Strs_22" "Strs_33"
Strains IDM=6
"STRN_XX" "STRN_YY" "STRN_ZZ" "STRN_XY" "STRN_YZ" "STRN_ZX"
Strain_invariants IDM=5
"Vol_stn" "Efstrn" "Strn_11" "Strn_22" "Strn_33"
Element_data IDM=2
"Porosity" "Elt_pore"
Coordinates IDM=2
"Coord_x"
"Coord_y"
Elastic_state_variables NUM=1
"YOUNG"
Plastic_state_variables NUM=9
"P_STRN" "P_STRNV" "P_STRNXX" "P_STRNYY" "P_STRNZZ" "P_STRNXY"
"P_STRNYZ" "P_COMC" "P_TENC"
* History_global
Output_frequency_time 0.1
Mech_global_energy_data IDM=2
"Kinetic" "Elastic"
Mech_convergence_data IDM=3
"Disp_norm" "Resid_norm" "Energy_norm"
|
1.A History_point is defined to output required data to plot: a.Compression path in vertical effective stress - void ratio space (Strs_YY, Porosity). b.Stress path in p'-q space (Press, Efstrs). c.Yield surface evolution during stress path (P_comc, P_tenc). d.Additional data that is not used. 2.History_point is located on the corner (X = 0.05 m, Y = 0.3 m). 3.History_global is defined to output Kinetic and Elastic energy that usually is used to visualise dynamic issues. |
|
Data File
|
|
* Time_scaling_factors
Optimal_time_step 1.0E-4
* Damping_global_data
Percentage_damping 0.02
|
1.A time step of 1.0E-4 is defined in Time_scaling_factors (as the simulation Termination_time is 5.0 this gives 50000 steps to complete the simulation). 2.Damping_global_data is defined with a percentage damping of 2% |
|
Data File
|
|
* Control_data
Control_title "ko test"
Solution_algorithm 1
Factor_critical_time_step 0.25
Maximum_number_time_steps 1E8
Termination_time 5.0
Screen_message_frequency 500
|
1.Data is self explanatory. |
|
Results for this example are in Mat_002\Case1\Results. History results are output to file Mat_002_Case1a.hdh and can be plotted in the Mat_002_Case1.xlsx excel sheet.
Note that during unloading there is a point in which the stress path meets the yield surface on the shear side leading to softening (see decrease in pc at time c.a. 4.4). At that time the vertical effective stress was c.a. 25 MPa so the elastic unloading path is considered to terminate there and further results are not plotted.
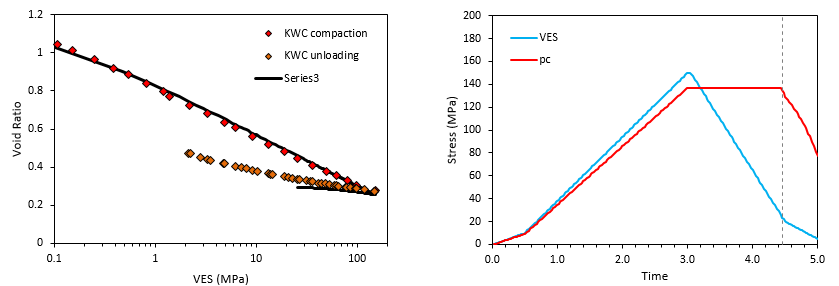
Results for KWC compaction calibration
The stress path during the entire simulation is shown below. The yield surface at the end of the compression phase is shown in black. Then there is unloading with a decrease in stress. Both deviatoric stress and effective mean stress decrease until deviatoric stress reaches a minimum value of 0 MPa at time c.a. 3.7 when Sxx, Syy and Szz have the same value. From that time onwards effective mean stress decreases while deviatoric stress increases until stress path meets the yield surface on the shear side. Subsequently there is effective mean stress and deviatoric stress decrease during softening.
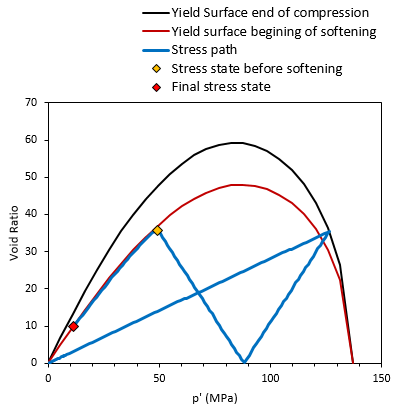 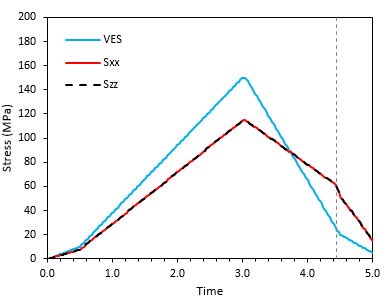
Stress Path during KWC oedometer test simulation (left) evolution of stresses as a function of time (right).
|
|
| Case1b: Kimmeridge clay/shale burial history |
Problem Description
A single axi-symmetric element will be considered to simulate a representative volume of Kimmeridge clay during its burial history. Perpendicular displacements are fixed at base, axis of symmetry and side. A surface load is applied on the top representing the overburden weight during Kimmeridge burial history. A time curve will be used to apply the appropriate load during the simulation. Temperature is prescribed at the whole surface. The appropriate temperature value during burial history is prescribed using a time curve.
In Nygård et al. (2004b) the authors estimate that Kimmeridge shale experienced a maximum vertical effective stress of 20MPa and a temperatures above 80 ºC. The burial history in Nygård et al. (2004b) is used to apply the appropriate boundary conditions. Thus the maximum vertical effective stress is assumed to occur at the maximum burial depth and stress at other depth points during burial history is determined proportionally with linear interpolation. Maximum temperature is also expected to occur at maximum burial depth. Thus in order to exceed 80 ºC at maximum burial depth a surface temperature of 20 ºC and a temperature gradient of 0.033 ºC/m is assumed. Note that the actual surface temperature/temperature gradient in the basin may be lower as the authors suggest that fluid movement may have contributed to additional heating that elevated temperature to 80 ºC.
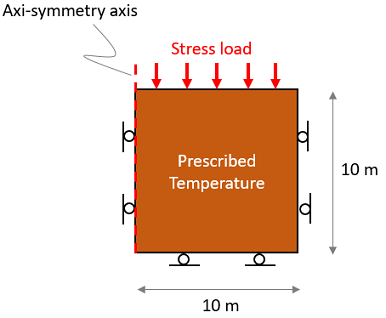 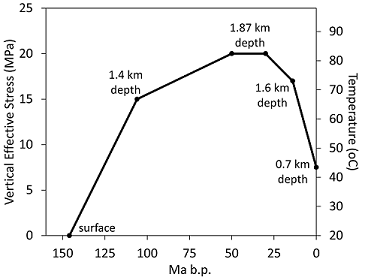
Geometry of the model (left) and Kimmeridge Clay burial history (right)
| Basic set up file description |
The initial data file for the project is: Mat_002\Case1\Data\Mat_002_Case1b.dat and the Mat_002_Case1b.mat. The basic data includes:
1A single group which is assigned the "KWC" properties defined using Group_control_data and Group_data data structures. The Porous_flow_type = 1 (i.e. a zero pore pressure porous material). 2Material properties (Material_data) for "KWC". 3Diagenesis_data for transition from KWC to KBC. 4Time scaling data (Time_scaling_data) with target time step 1E-4s (see Mech_002). 5Global damping (Damping_global_data) for the geomechanical field with 2% percentage damping (see Mech_002). 6Two Global_loads case with their corresponding Time_curve_data that will be used to: a. Define stress load during burial history b.Define temperature evolution during burial history 7Support_data defining perpendicular displacement fixities for lines 1, 2 and 4 . 8A History_point) to output the history results to plot them in excel. 9Mesh_control_data and a Structured_mesh_data defining a single element (1 division). 10 Control_data for a single stage.
|
Data File
|
|
* Group_control_data
Group_numbers IDM=1
1
Active_geomechanical_groups IDM=1
1
* Group_data NUM=1
Group_name "KWC"
Element_type_number 9
Material_name "KWC"
Surfaces IDM=1
1
Porous_flow_type 1
|
1.A single group is defined with geomechanical field active 2.Group name is "KWC" 3.Element type is Axi-symmetric (Element_type_number = 9) 4.Assigned material is KWC. 5.Group is assigned to the only surface defined 6.Group is defined dry porous (Porous_flow_type = 1) |
|
The previous calibrated material data properties in Case1a are used. In here only the diagenetic properties and the assignment of the diagenetic properties are discussed.
Data File
|
|
* Material_data
Name "KWC"
(...)
Diagenesis_reaction_names IDM=1
"KWC_to_KBC"
(...)
* Diagenesis_data
Name "KWC_to_KBC"
Maximum_porosity_change 0.147
Compaction_direction_factor 0.0
Reaction_model_name "Power"
Reaction_properties IDM=4
0.12
1.0
70.0
1.0
Cementation_model_name "Enhanced_pt"
Cementation_properties IDM=1
6.0
Compaction_model_name"Enhanced_hardening"
Compaction_properties IDM=3
0.135
-0.024
-0.075
|
1.In Material_data the diagenesis reaction that will be considered is assigned via Diagenesis_reaction_names. Note that more than 1 diagenetic reaction may be assigned to any material.
2.Diagenesis_data to capture the transition from KWC to KBC properties is defined. 3.The maximum porosity change for this reaction is defined as 0.147 (14.7 % of porosity can be lost due to this diagenetic reaction).
4.Compaction_direction_factor defines whether the reaction is uniaxial (0.0) or isotropic (1.0)
5.A power law reaction-rate is adopted. The parameters are calibrated according to the data so that:
a.Initiation temperature of 70ºC is assumed
b.At the end of burial history the diagenetic porosity loss is equal to the maximum diagenetic porosity loss (0.147)
6.Tensile intercept increase with diagenesis is defined. The data is set so that when the maximum diagenetic porosity loss is achieved pt increases by 6.0 MPa.
7.Compaction model is set to "Enhanced_hardening":
a.Factor porosity change defines the contribution of the diagenetic porosity loss to increase in pc (strength increase). The larger the factor the larger the increase in pc for a given diagenetic porosity loss. This is calibrated in order to capture the transition from elastic to plastic in the KBC curve from Nygård et al. (2004a) data.
b.Change in kappa defines the maximum reduction in kappa (stiffening) due to diagenesis once the maximum diagenetic porosity loss for the reaction is achieved. The change in kappa at time t is proportional to the relative fraction of the maximum porosity loss at time t. This is calibrated to capture the right slope in the unloading line on the KBC curve.
c.Change in Lambda defines the maximum reduction in Lambda due to diagenesis once the maximum diagenetic porosity loss for the reaction is achieved. The change in kappa at time t is proportional to the relative fraction of the maximum porosity loss at time t. This is calibrated to capture the right slope in the post yield compaction curve slope on the KBC curve.
|
|
Data File
|
|
* Support_data
Displacement_codes IDM=3 JDM=4
1 1 0
0 1 0
1 0 0
0 0 0
Displacement_code_lines IDM=3 JDM=2
1 2 4
2 3 3
|
1.Support_data is set defining displacement fixities in normal direction to base, side and axis of symmetry. |
|
Two load data structures to simulate stress load and temperature load due to burial are defined.
Data File
|
|
* Global_loads NUM=1
Surface_load IDM=2 JDM=1
1.0 0.0
Surface_load_type 1
Surface_load_line_pointers IDM=1 JDM=2
3
1
* Time_curve_data NUM=1
Time_curve IDM=6
0.0 40.0 96.0 116.0 132.0 146.0
Load_factor IDM=6
0 15 20 20 17 7.5
* Global_loads NUM=2
Prescribed_temperature IDM=1 JDM=1
1
Prescribed_temperature_surfaces IDM=1 JDM=2
3
1
* Time_curve_data NUM=2
Time_curve IDM=6
0.0 40.0 96.0 116.0 132.0 146.0
Load_factor IDM=6
0 15 20 20 17 7.5
* Load_case_control_data
Loadcases IDM=2
1 2
Active_load_flags IDM=2
2 2
|
1.Two Global_loads data structures are defined to prescribe axial stress and surface temperature.
2.The Time_curve_data structures are defined so that the prescribed stress and temperature simulate the Kimmeridge Clay burial history from Nygård et al. (2004b) shown below.

3.Load_case_control_data is defining both load cases as active.
|
|
Data File
|
|
* Mesh_control_data
Generation_algorithm 1
Mesh_generation_flag 0
* Structured_mesh_data
Default_divisions 1
Surfaces IDM=1
1
|
1.A structured mesh is defined in Mesh_control_data (Generation_algorithm = 1). 2.A single division is defined in order to perform a single element simulation. |
|
Data File
|
|
* History_point NUM=1
Name "Set1"
Group 1
Output_frequency_time 1
Point_coordinates IDM=2 JDM=1
10.0 10.0
Displacements IDM=2
"Disp_x" "Disp_y"
Stresses IDM=3
"Strs_xx" "Strs_yy" "Strs_zz"
Stress_invariants IDM=2
"Press" "Efstrs"
Element_data IDM=3
"Porosity" "Elt_pore" "Elt_temp"
Elastic_state_variables IDM=1
"Young"
Plastic_state_variables NUM=7
"P_Strn" "P_Strnv" "P_Strnxx" "P_Strnyy" "P_Strnzz"
"P_comc" "P_tenc"
Diagenesis_state_variables IDM=2
"C_poros" "C_poros1"
Poroelastic_state_variables IDM=1
"E_kappa"
Hardening_state_variables NUM=1
"H_lambda"
* History_global
Output_frequency_time 0.1
Mech_global_energy_data IDM=2
"Kinetic" "Elastic"
Mech_convergence_data IDM=3
"Disp_norm" "Resid_norm" "Energy_norm"
|
1.A History_point is defined to output required data to plot: a.Compression path in vertical effective stress - void ratio space (Strs_YY, Porosity). b.Stress path in p'-q space (Press, Efstrs). c.Yield surface evolution during stress path (P_comc, P_tenc). d.Diagenetic porosity loss (C_poros). Note that C_poros1 corresponds to the diagenetic porosity loss in reaction number 1 which in this case as there is only one reaction should be equal to C_poros. e.Evolution of Lambda and Kappa. f.Additional data that is not used. 2.History_point is located on the corner (X = 10 m, Y = 10 m). 3.History_global is defined to output Kinetic and Elastic energy that usually is used to visualise dynamic issues. |
|
Data File
|
|
* Time_scaling_factors
Optimal_time_step 1.0E-4
* Damping_global_data
Percentage_damping 0.02
|
1.A time step of 1.0E-4 is defined in Time_scaling_factors (as the simulation Termination_time is 5.0 this gives 50000 steps to complete the simulation). 2.Damping_global_data is defined with a percentage damping of 2% |
|
Data File
|
|
* Control_data
Control_title "burial"
Solution_algorithm 1
Factor_critical_time_step 0.7
Maximum_number_time_steps 1E8
Termination_time 146.0
Screen_message_frequency 10000
* Time_curve_data NUM=1
Time_curve IDM=5
146 175 177 198 200
Load_factor IDM=5
7.5 0.2 0.2 150 150
* Time_curve_data NUM=2
Time_curve IDM=3
146 147 200
Load_factor IDM=3
43 20 20
* Control_data
Control_title "unload"
Solution_algorithm 1
Factor_critical_time_step 0.7
Maximum_number_time_steps 1E8
Termination_time 175.0
Screen_message_frequency 10000
* Control_data
Control_title "reload"
Solution_algorithm 1
Factor_critical_time_step 0.7
Maximum_number_time_steps 1E8
Termination_time 200.0
Screen_message_frequency 10000
|
1.Data is self explanatory. 2.During the first stage (146 Ma) the burial history of kimmeridge clay is simulated. 3.Two additional stages are included in order to test the resulting material (KBC) by imposing additional unload and additional loading post enhanced yield point. This will facilitate evaluation of the calibrated properties. 4.The time curves for stress and temperature loads are overwritten after simulation of burial history so that: a.Stress curve imposes unloading to 0.2 MPa with subsequent reloading to 150 MPa b.Temperature curve imposes decrease of temperature to 20ºC (lab conditions). Note however that this has no impact on results as the maximum diagenetic porosity loss was already achieved. |
|
Results for this example are in Mat_002\Case1\Results. History results are output to file Mat_002_Case1b.hdh and can be plotted in the Mat_002_Case1.xlsx excel sheet.
As can be seen in the figures below the calibrated diagenesis reaction successfully captures the change from KWC to KBC properties. At the end of the simulated history the VES - Void Ratio point plots on the KBC curve. In addition the further unload and reload simulated under lab conditions demonstrated that the material characterisation represents quite well the KBC rheology.
In the plots of material properties as a function of time in can be seen the effect of diagenesis. As the diagenetic porosity loss increases lambda and kappa decrease whereas the magnitude of pc and pt increase.
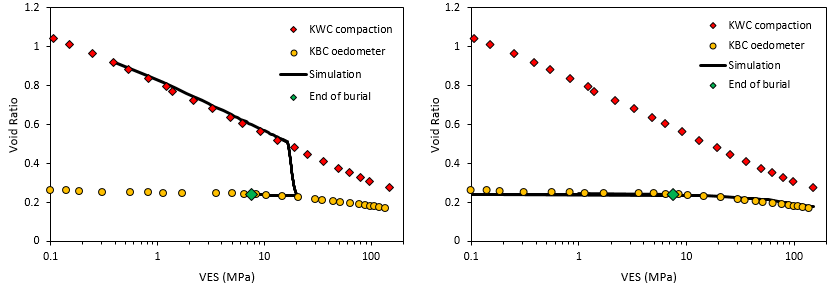
Results compared to geomechanical tests. Simulation of burial history (left). Additional unloading and reloading (right).

Evolution of material properties with time.
|
|
Nygård, R., Gutierrez, M., Bratli, R. K., & Høeg, K. (2006). Brittle-ductile transition, shear failure and leakage in shales and mudrocks. Marine and Petroleum Geology, 23(2), 201–212.
Nygård, R., Gutierrez, M., Gautam, R., & Høeg, K. (2004a). Compaction behaviour of argillaceous sediments as function of diagenesis. Marine and Petroleum Geology, 21(3), 349–362.
Nygård, R., Gutierrez, M., Høeg, K., & Bjørlykke, K. (2004b). Influence of burial history on microstructure and compaction behaviour of Kimmeridge clay. Petroleum Geoscience, 10(3), 259–270.
Obradors-Prats, J., Rouainia, M., Aplin, A. C. and Crook, J. L. (2019) A diagenesis model for geomechanical simulations: formulation and implications for pore pressure and development of geological structures. Journal of Geophysical Research: Solid Eath. Vol 124 (5) pp. 4452-4472.
|


