Ex_002_Case01 Base case
In this base case a drop in 6 MPa in reservoir pore pressure will be imposed during depletion. Pore pressure is defined at mesh nodes in Spatial_grid data and assigned using Spatial_boundary. The data files for the examples is found in: ParaGeo Examples\General Examples\Ex_002\Case01\Data. Note that only key data will be discussed.
Geostatic_data
Geostatic_control_data
Spatial_grid
Spatial_boundary
Top surface load
|
| Results |
The result files for the project are in directory: ParaGeo Examples\General Examples\Ex_002\Case01\Results.
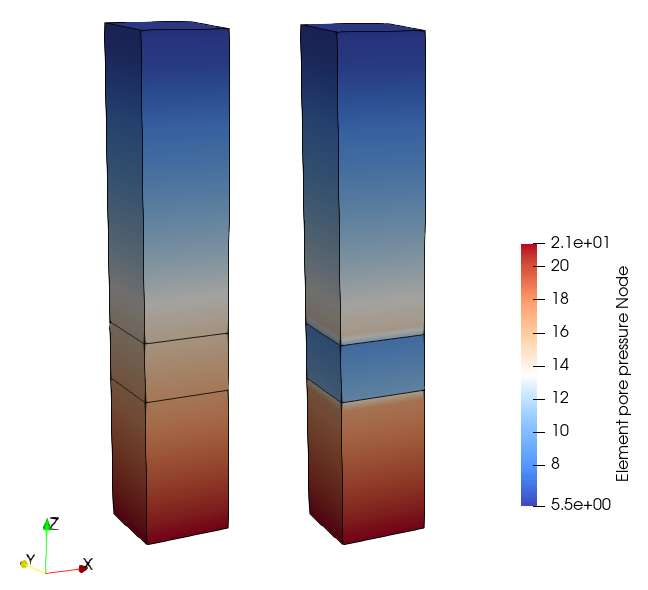
The plots below show that the pore pressure in the reservoir has dropped after depletion. History results show:
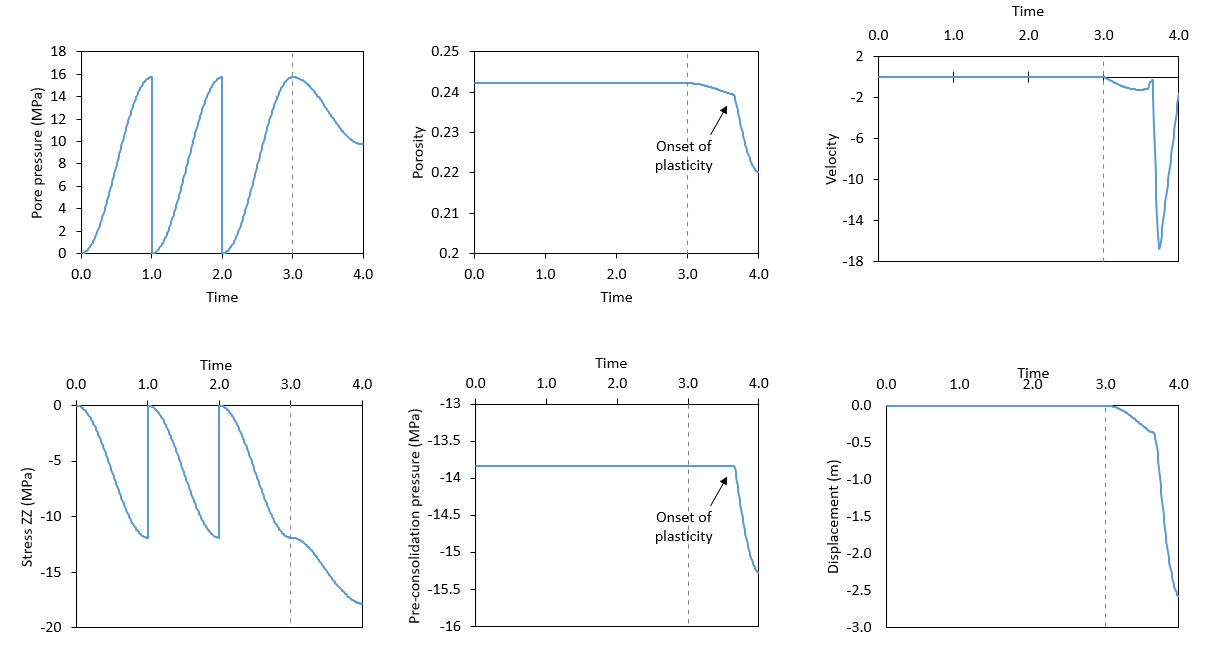
1.Elastic initialization phase from time 0 to time 1, Non-linear initialization from time 1 to 2, displacement re-initialization from time 2 to 3 and and reservoir depletion from time 3 to time 4. Note that displacements during initialisation have been negligible at the history point location. Consequently the effects of displacement reinitialisation are not observable.
2.The drop in pore pressure is performed gradually following an s-shaped function. The decrease in pore pressure lead to a stress increase. This results in porosity decrease, initially following an elastic path, and then developing plastic strains (see the increase in pre-consolidation pressure magnitude).
Pore pressure after initialization (left) and after depletion (right) stages
History results in a point located in the centre of the reservoir. The grey discontinuous line indicates the end of initialization and the onset of the depletion stage.
|


