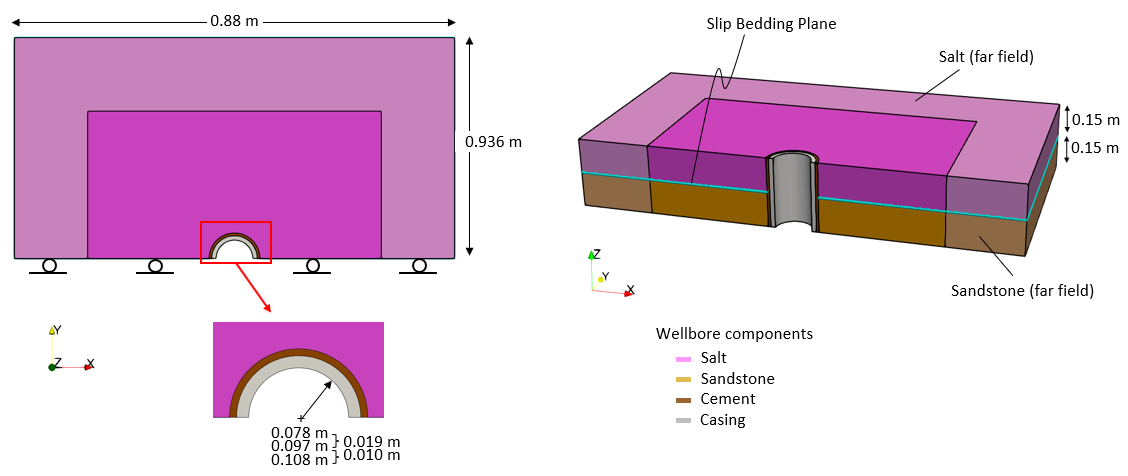
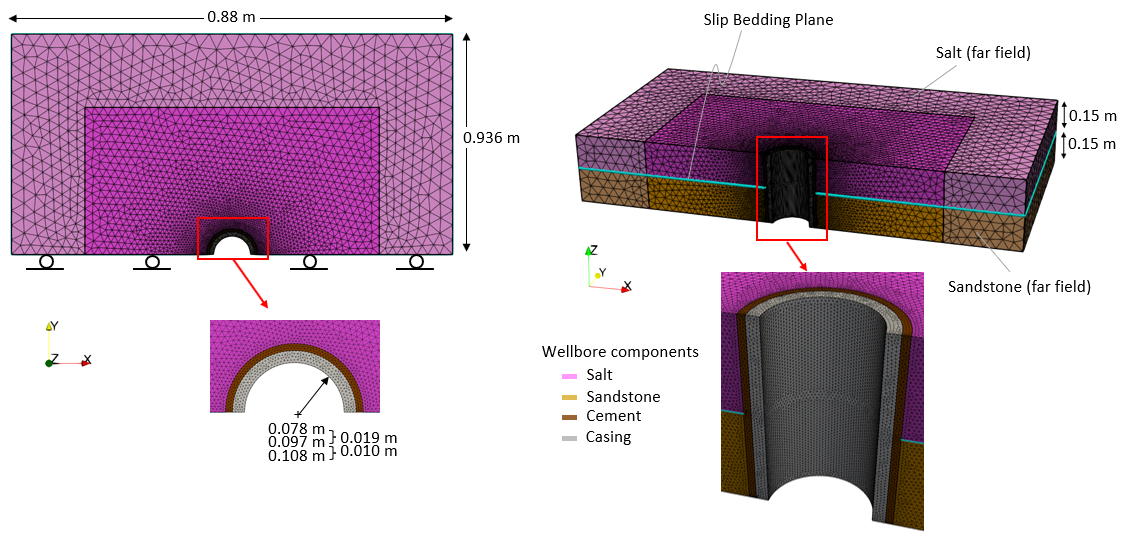
This example provides an introduction to casing collapse due to shear at a salt/sandstone bedding plane in a cased and cemented 3D wellbore model. The model involves a mechanical only solution strategy with prescribed constant temperatures and pore pressures. The model geometry considers a half symmetry with normal displacements constrained on the symmetry boundaries. Note that the length of the casing in this example model is set artificially short for simulation speed - ideally the casing length should be longer. The model dimensions are indicated in the figures below. The various components are discretized into tetrahedral elements with finer mesh at the wellbore.
Features of the example comprise:
1Mechanical only simulation with prescribed constant temperatures and pore pressures.
2Casing-Cement and Cement-Formation material interfaces are assumed fully bonded.
3Half-symmetry two layer model with contact slip at the salt/sandstone bedding plane.
4Large shear deformation of the salt layer.
Units of the model for stress, length, time and temperature are Pa, m, years and Celsius respectively. The simulation run completes in 2.4hrs on a 3.6 GHz AMD processor machine.
|
Wellbore Model Geometry (Half-Symmetry)
|
|
Wellbore Model Mesh Definition (Half-Symmetry)
|
The simulation comprises three stages with the timings* summarized in the table below :
Stage #
|
Description
|
Duration* (years)
|
Time lapse (years)
|
Stage 1
|
Initialization
|
0.3
|
0 - 0.3
|
Stage 2
|
Drilling + Casing/Cement installation
|
0.2
|
0.3 - 0.5
|
Stage 3
|
Apply contact slip displacement loading to salt layer
|
1.0
|
0.5 - 1.5
|
* The timings have been arbitrarily chosen simply to demonstrate simulation work-flow.
Stage 1: Initialization
1.Apply initial geostatic condition (stresses, pore pressure and temperature) to the various wellbore components with a "Step_scurve" load function:
i.Formation layer #1 (Sandstone): Effective stresses of σ1x' = -5.3·107 Pa, σ1y' = -5.4·107 Pa, σ1z' = -5.6·107 Pa, an initial pore pressure of Pp = 4.3·107 Pa and an initial temperature of T0 = 120°C.
ii.Formation layer #2 (Salt): Hydrostatic total stress values of -9.3·107 Pa. This is defined as effective stresses of σ2x' = σ2y' = σ2z' = -5.0·107, an initial pore pressure of Pp = 4.3·107 Pa) and an initial temperature of T0 = 120°C.
iii.Casing and Cement: Hydrostatic effective stresses of σ3x' = σ3y' = σ3z' = -4.3·107 Pa, an initial pore pressure of P0 = 0 Pa and an initial temperature of T0 = 120°C.
Note that this is a mechanical only simulation with initial pore pressure and temperature remaining constant throughout.
2.Materials - constitutive stresses and viscoplasticity are slowly ramped up with geostatic initialization.
3.Contact stresses at the salt/sandstone bedding plane are slowly ramped up with geostatic initialization.
4.Apply appropriate mechanical constraints to all external boundaries:
i.Symmetry and far-field boundaries : Fix the displacements in the perpendicular direction for outer/'far-field' boundary and all symmetry surfaces.
ii.Base and top: Fix the vertical displacements for the base and top surfaces for all three wellbore components.
iii.Inner casing: Fix the displacements in X and Y on the inner casing wall.
iv.Far-field bedding plane contact interfaces: Fix the vertical displacements for the far-field bedding plane contact interfaces. This is in order that during the slip displacement loading, the 'exposed' contact interface of the model has a vertical support constraint. Note that in the field, there will always be rock material providing this vertical constraint during slip.
At the end of this stage, initial conditions (stress, pore pressure and temperature) for all wellbore components are applied, contact stresses at the salt/sandstone bedding plane are fully established and the material constitutive models defined in the data are utilized.
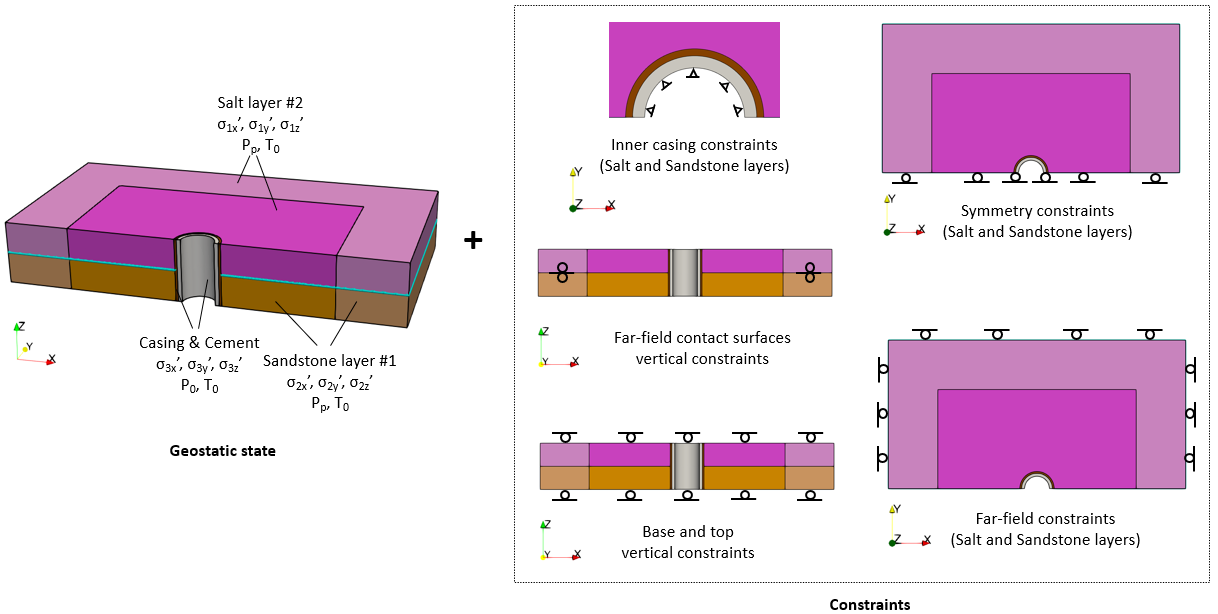
Schematic of initial geostatic condition and and constraints during pre-drill initialization phase
Stage 2: Drilling + Casing/Cement Installation
1.Constraint release: The constraints on the casing inner wall are removed and equivalent stresses slowly ramped down to zero over the stage duration using the Constraint_relaxation data structure.
2.Application of mud pressure: Mud stress σm of 4.5·107 Pa (i.e. 2·106 Pa above Pp) is applied to the inner casing surface as the constraints on the casing are relaxed down to zero.
At the end of this stage, the casing with internal mud stress loading is fully supporting the formation stresses.

Schematic of boundary conditions during drilling + casing/cement installation phase
Stage 3: Contact Slip Displacement
1.A horizontal displacement in X is applied to the end surfaces (Y-Z plane) of the salt layer to shear over the salt/sandstone (slip) bedding plane.
Note that the displacement value is an arbitrary value chosen simply to demonstrate the simulation work-flow for casing collapse due to shearing.
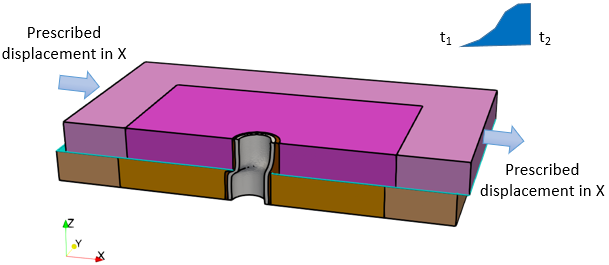
Shear displacement of salt layer over salt/sandstone (slip) bedding plane
Material Properties
The materials are defined in a separate file named Wellbore_002_Case01.mat which is included in the main datafile using the command Include. The material model types for the different wellbore components are defined as:
•Sandstone (Layer 1) - Modified Drucker-Prager plasticity model with Cam-Clay poro-elasticity. Note that the far-field sandstone material is defined as elastic.
•Salt (Layer 2) - Herschel-Bulkley elasto-viscoplastic model (temperature-dependent) with yield stress set to 105 Pa and the viscosity at large stresses asymptotic to 5·1010 Pa.year as shown in the plot below of salt viscosity as a function of deviatoric stress and strain rate. Note that the far-field salt material is defined as elastic.

Salt Viscosity (at 120 °C) in Pa.year as a function of Deviatoric Stress
•Casing - von Mises plasticity model.
•Cement - SR4 pressure dependent plasticity model.
Details of the material property parameters for the various components will not be described in this tutorial.
The data files for the example are in directory: ParaGeo_Tutorial_Examples\Wellbore_002\Case01\Data.
Group control data and Group data
Data File
|
|
* Group_control_data
Group_numbers IDM=6
1 2 3 4 5 6
Active_geomechanical_groups IDM=6
1 1 1 1 1 1
* Group_data NUM=1
Group_name "Casing3D"
Element_type "Tet4v"
Material_name "Casing"
Porous_flow_type 2
Geometry_set "Casing3D"
.....
|
1Group numbers 1 to 6 correspond to casing, cement, sandstone, salt, sandstone (far-field) and salt (far-field). 2All geomechanical groups are set to 1 (active).
|
Key Geometry set data
Data File
|
|
* Geometry_set NUM=1
Name "Casing3D"
Set_type "Group"
Volumes IDM=1
1
* Geometry_set NUM=2
Name "Cement3D"
Set_type "Group"
Volumes IDM=1
2
* Geometry_set NUM=3
Name "Formation_lay1"
Set_type "Group"
Volumes IDM=1
3
* Geometry_set NUM=4
Name "Formation_lay2"
Set_type "Group"
Volumes IDM=1
4
* Geometry_set NUM=5
Name "FarFormation_lay1"
Set_type "Group"
Volumes IDM=1
5
* Geometry_set NUM=6
Name "FarFormation_lay2"
Set_type "Group"
Volumes IDM=1
6
.....
* Geometry_set NUM=30
Name "Cnt_lay1_2_ftw_far"
Surfaces IDM=1
11
* Geometry_set NUM=31
Name "Cnt_lay1_2_hgw_far"
Surfaces IDM=1
44
|
1Geometry_set data are defined for the six model groups and any geometry surface/s that will be used in the definition of the support data and contact assignments.
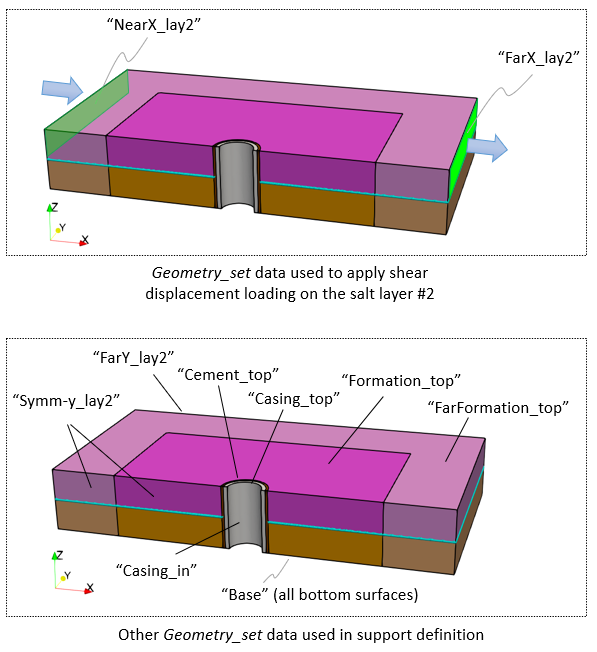
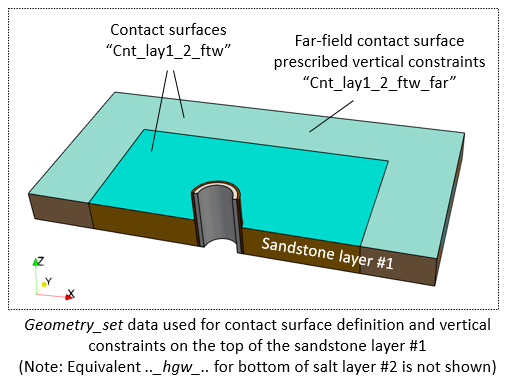
|
|
Contact global data
Data File
|
|
* Contact_global
Included_contact_sets IDM=1
"All"
All_geometry_flag 0
Algorithm 1
|
1The contact algorithm is defined as 1 for node-facet contact (default).
|
Contact set and Contact surface data
Data File
|
|
* Contact_set NUM=1
Name "All"
Contact_surfaces IDM=2
"Cnt_lay1_2_ftw"
"Cnt_lay1_2_hgw"
Global_update_frequency 500
Property_name "Lay1_2_cntprop"
Buffer_factor 1.0
Print_search 1
* Contact_surface NUM=1
Name "Cnt_lay1_2_ftw"
Property_name "Lay1_2_cntprop"
Set_name "All"
* Contact_surface NUM=2
Name "Cnt_lay1_2_hgw"
Property_name "Lay1_2_cntprop"
Set_name "All"
|
1The Contact_set data defines the following in addition to contact interaction and geometric threshold data : a.Contact_surfaces or alternatively Geometry_sets define the two contacting surfaces of the salt/sandstone interface. b.Property_name specified as "Lay1_2_cntprop" defines the name of the contact property data in Contact_property.
|
Contact property data
Data File
|
|
* Contact_property NUM=1
Name "Lay1_2_cntprop"
Compression_model 1
Compression_properties IDM=1
/Normal Penalty/ 1000.0E6
Tangential_model 2
Tangential_properties IDM=2
/Tangential Penalty/ 1000.0E6
/Friction coefficient/ 0.6
|
1Contact_property with name of "Lay1_2_cntprop" defines the contact property data: a.Normal and tangential penalty values are defined as 1000E6 Pa/m. b.Friction coefficient of 0.6 is defined.
|
|
Geostatic_data
Data File
|
|
* Geostatic_data NUM=1
Name "Fm_Layer1"
Groups IDM=2
"Formation_lay1"
"FarFormation_lay1"
Initial_stress IDM=3
-5.3E+07 -5.4E+07 -5.6E+07
Pore_pressure_distribution "Constant"
Pore_pressure 4.3E+7
Temperature 120
Time_curve "Step_scurve"
* Geostatic_data NUM=2
Name "Fm_Layer2"
Groups IDM=2
"Formation_lay2"
"FarFormation_lay2"
Initial_stress IDM=3
-5.0E+07 -5.0E+07 -5.0E+07
Pore_pressure_distribution "Constant"
Pore_pressure 4.3E+7
Temperature 120
Time_curve "Step_scurve"
* Geostatic_data NUM=3
Name "Casing3D_Cement3D"
Groups IDM=2
"Casing3D"
"Cement3D"
Initial_stress IDM=3
-4.3E+7 -4.3E+7 -4.3E+7
Pore_pressure_distribution "Constant"
Pore_pressure 0.0
Temperature 120
Time_curve "Step_scurve"
|
1In the first stage Geostatic_data is specified to slowly ramp up the initial stress state, prescribed constant pore pressure and temperature for the three sets of wellbore components using a "Step_scurve" load function :
Parameter
|
Fm_Layer1
(Sandstone groups)
|
Fm_Layer2
(Salt groups)
|
Casing3D_Cement3D
(Casing and Cement groups)
|
Temperature
|
120°C
|
120°C
|
120°C
|
Pore pressure
|
43·106 Pa
|
43·106 Pa
|
0 Pa
|
Effective stress σx'
|
53·106 Pa
|
50·106 Pa
|
43·106 Pa
|
Effective stress σy'
|
54·106 Pa
|
50·106 Pa
|
43·106 Pa
|
Effective stress σz'
|
56·106 Pa
|
50·106 Pa
|
43·106 Pa
|
Total stress σx
|
96·106 Pa
|
93·106 Pa
|
43·106 Pa
|
Total stress σy
|
97·106 Pa
|
93·106 Pa
|
43·106 Pa
|
Total stress σz
|
99·106 Pa
|
50·106 Pa
|
43·106 Pa
|
Notes:
At the end of this stage, initial conditions (stress, pore pressure and temperature) for all wellbore components are applied, contact stresses at the salt/sandstone bedding plane are fully established and the material constitutive models defined in the data are utilized.
|
Support_data
Data File
|
|
* Support_data
Displacement_codes IDM=3 JDM=4
1 0 0
0 1 0
0 0 1
1 1 0
Displacement_code_geom_set IDM=16
"Symm-y_lay1"
"Symm-y_lay2"
"FarY_lay1"
"FarY_lay2"
"NearX_lay1"
"NearX_lay2"
"FarX_lay1"
"FarX_lay2"
"Base"
"Casing_top"
"Cement_top"
"Formation_top"
"FarFormation_top"
"Casing_in"
"Cnt_lay1_2_ftw_far"
"Cnt_lay1_2_hgw_far"
Displacement_code_geom_ass IDM=16
2 2 2 2 1 1 1 1 3 3
3 3 3 4 3 3
|
1Mechanical constraints are applied to all geometry sets representing the external boundaries and far-field contact surfaces: a.Symmetry boundaries ("Symm-y_lay1" and "Symm-y_lay2") - Fix the displacements in the Y-direction. b.Far-field boundaries in X-Z plane ("FarY_lay1" and "FarY_lay2") - Fix the displacements in the Y-direction. c.Far-field boundaries in Y-Z plane ("NearX_lay1", "NearX_lay2", "FarX_lay1" and "FarX_lay2") - Fix the displacements in the X-direction. Note that "NearX_lay2" and "FarX_lay2" will be prescribed displacement loading in X-direction in Stage 3 contact slip analysis. d.Base and top ("Base", "Casing_top", "Cement_top", "Formation_top" and "FarFormation_top"): Fix the vertical displacements in Z for the base and top surfaces for all three wellbore components. e.Inner casing ("Casing_in"): Fix the displacements in X and Y on the inner casing wall. Note that this constraint will be removed in the next stage during the drilling + casing/cement installation phase. f.Far-field bedding plane contact interfaces: Fix the vertical displacements for the far-field bedding plane contact "hanging wall" and "footwall" surfaces (shown in cyan in picture below). This is in order that during the slip displacement loading, the 'exposed' contact interface of the model has a vertical support constraint. Note that in the field, there will always be rock material providing this vertical constraint during slip.
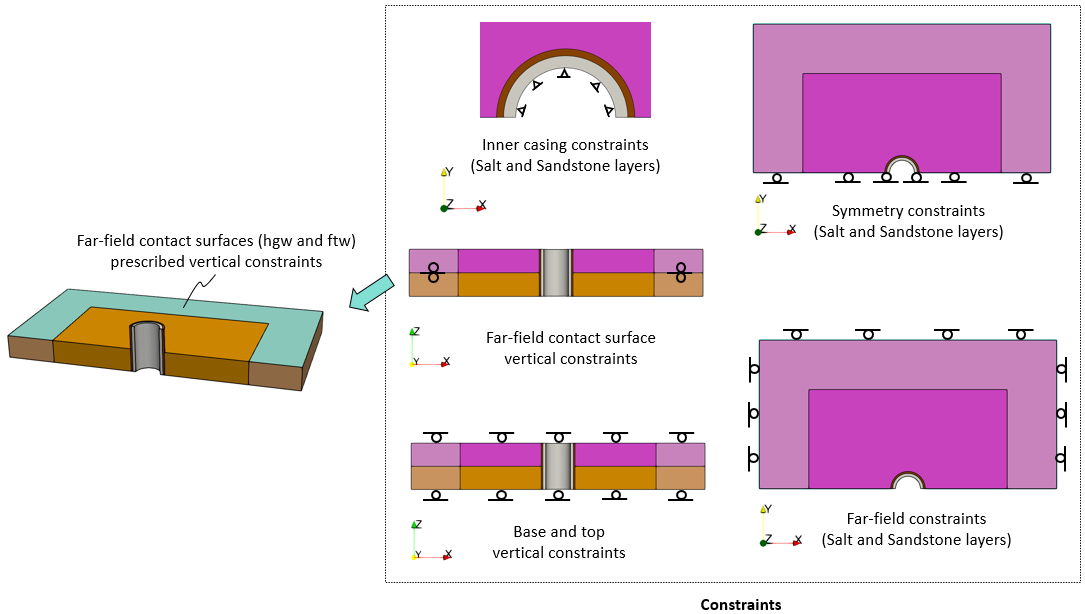
|
History data (optional)
•Several history data have been defined for monitoring the results at each of the wellbore components as well as the contact parameters at the salt/sandstone bedding plane. However, these are optional and will not be discussed here.
Solution control data
Data File
|
|
* Control_data
Control_title "Initialization"
Duration 0.3
Solution_algorithm 1
Maximum_number_time_steps 200000
Target_number_time_steps 15000
Factor_critical_time_step 0.7
Screen_message_frequency 100
Output_time_plotfile 0.1
Output_frequency_plotfile -1
Output_frequency_restart -1
|
1The Target_number_time_steps is set to 15000 over a stage duration of 0.3 for this initialization phase.
Note that in this example, 15000 steps are deemed sufficient for the initialization stage 1.
|
|
Constraint_relaxation data
Data File
|
|
* Constraint_relaxation
Displacement_geom_set IDM=1
"Casing_in"
Time_curve 200
* Time_curve_data NUM=200
Name "constrain_relax"
Time_curve IDM=2
0.3 0.5
Load_factor IDM=2
1 0
Curve_type 2
|
1The Constraint_relaxation data structure is applied to the inner casing wall. This enables the equivalent stress to replace the fixity conditions to be applied and gradually ramped down to zero over the stage duration.
2By default, an sramp function is used to relax the stresses, however, in this case, we will use a Time_curve_data to define an s-curve type (2) ramp to relax the stresses in order to be consistent with the load curve used to apply the mud stress.
|
Support_data
Data File
|
|
* Support_data
Displacement_codes IDM=3 JDM=4
1 0 0
0 1 0
0 0 1
1 1 0
Displacement_code_geom_set IDM=15
"Symm-y_lay1"
"Symm-y_lay2"
"FarY_lay1"
"FarY_lay2"
"NearX_lay1"
"NearX_lay2"
"FarX_lay1"
"FarX_lay2"
"Base"
"Casing_top"
"Cement_top"
"Formation_top"
"FarFormation_top"
"Cnt_lay1_2_ftw_far"
"Cnt_lay1_2_hgw_far"
Displacement_code_geom_ass IDM=15
2 2 2 2 1 1 1 1 3 3
3 3 3 3 3
|
1Support_data is overwritten and the only difference compared to stage 1 is that the displacements at the inner casing wall are no longer constrained.
|
Loading data
Data File
|
|
* Global_loads NUM=1
Name "Mud_Stress_casing"
Surface_load IDM=3 JDM=1
1 0 0
Surface_load_geom_set IDM=1
"Casing_in"
Surface_load_geom_ass IDM=1
1
* Time_curve_data NUM=1
Name "Mud_Stress_casing"
Time_curve IDM=2
0.3 0.5
Load_factor IDM=2
0 4.5E+07
Curve_type 2
* Load_case_control_data
Loadcases IDM=1
1
Active_load_flags IDM=1
2
|
1Global_loads NUM=1 correspond to the application of mechanical load of the drilling mud ramped up to 4.5·107 Pa using an s-curve type (2) load ramp. This is applied to the inner casing wall.
Notes:
•Application of drilling mud load usually involves a mechanical component and a pore pressure component. In this example, since the drilling mud is applied to the inner wall of the casing which is defined as total stress with zero pore pressure and porous flow de-activated, only the mechanical component will be of consideration.
|
Solution control data
Data File
|
|
* Control_data
Control_title "Drill_Casing_Cement_Install"
Duration 0.2
Solution_algorithm 1
Maximum_number_time_steps 200000
Target_number_time_steps 5000
Factor_critical_time_step 0.7
Screen_message_frequency 100
Output_frequency_plotfile -1
Output_frequency_restart -1
|
1The Target_number_time_steps is set to 5000 over a stage duration of 0.2 for this stage.
|
|
Loading data
Data File
|
|
* Global_loads NUM=2
Name "Slip_displacement"
Prescribed_displacement IDM=3 JDM=1
/Set1/ 0.05 0 0
Pres_displacement_geom_set IDM=2
"NearX_lay2"
"FarX_lay2"
Pres_displacement_geom_ass IDM=2
1 1
* Time_curve_data NUM=2
Name "Slip_displacement"
Time_curve IDM=2
0.5 1.5
Load_factor IDM=2
0 1.0
Curve_type 2
* Load_case_control_data
Loadcases IDM=2
1 2
Active_load_flags IDM=2
2 2
|
1Global_loads NUM=2 corresponds to the horizontal displacement in X applied to the end surfaces (Y-Z plane) of the salt layer to shear over the salt/sandstone (slip) bedding plane. This displacement is applied with an s-curve type (2) load ramp over a duration of 1.0 time unit.
Notes:
The same Support_data from the previous stage, which includes constraints in X for these two end surfaces, is applicable in this stage, so need not be re-defined as it is automatically carried over to the current stage.
|
Solution control data
Data File
|
|
* Control_data
Control_title "Contact_slip"
Duration 1.0
Solution_algorithm 1
Maximum_number_time_steps 200000
Target_number_time_steps 40000
Factor_critical_time_step 0.7
Screen_message_frequency 100
Output_time_plotfile 0.2
Output_frequency_plotfile -1
Output_frequency_restart -1
|
1The Target_number_time_steps is set to 40000 over a stage duration of 1.0 for this stage.
|
|
The result files for the project are in directory: ParaGeo_Tutorial_Examples\Wellbore_002\Case01\Results.
The plot below shows the progression of deformed configuration for the cased and cemented wellbore with increasing shear displacement of the salt layer over the salt/sandstone slip bedding plane.
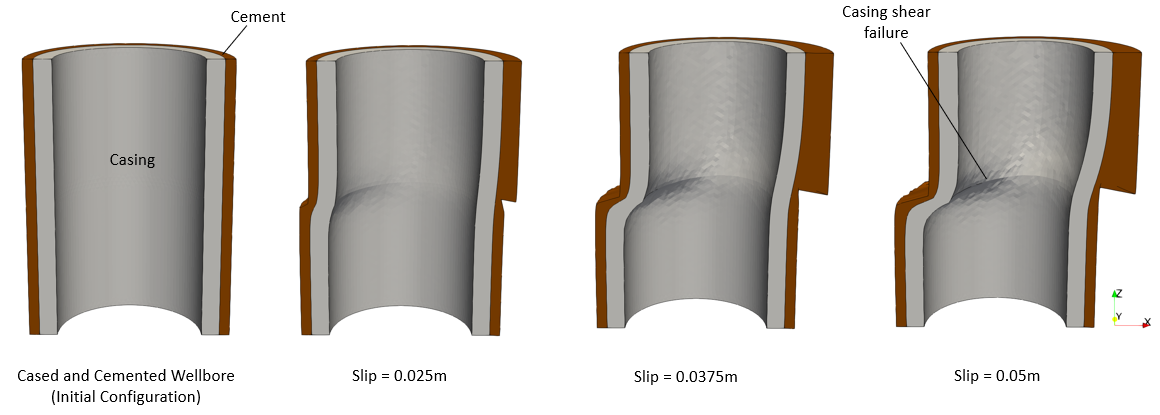
Progression of deformed wellbore cased and cemented configuration with increasing bedding plane slip
The horizontal displacement in X in the wellbore model is shown in the plot below.
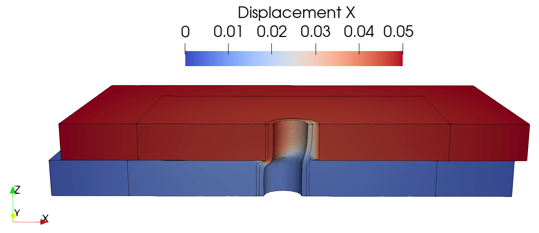
Horizontal displacement in X of wellbore model at final configuration
The viscoplasticity parameters in the salt layer #2 is monitored at a point in the middle of the layer for viscoplastic stress, viscosity, strain rate and deviatoric stress.
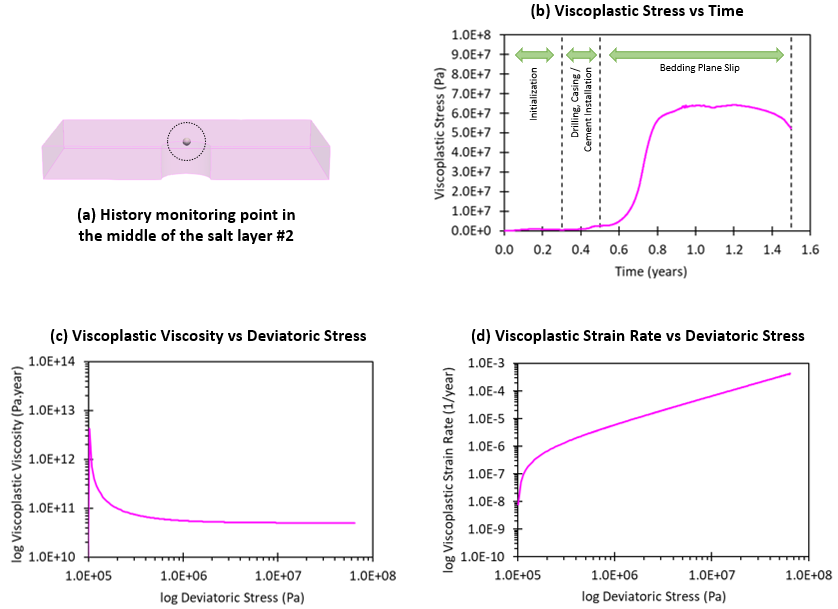
Graphical plots of various viscoplasticity parameters and deviatoric stress monitored at a point in the middle of the salt layer #2 during the simulation
Contour plots of some viscoplastic parameters in the salt layer #2 at final configuration are shown below.
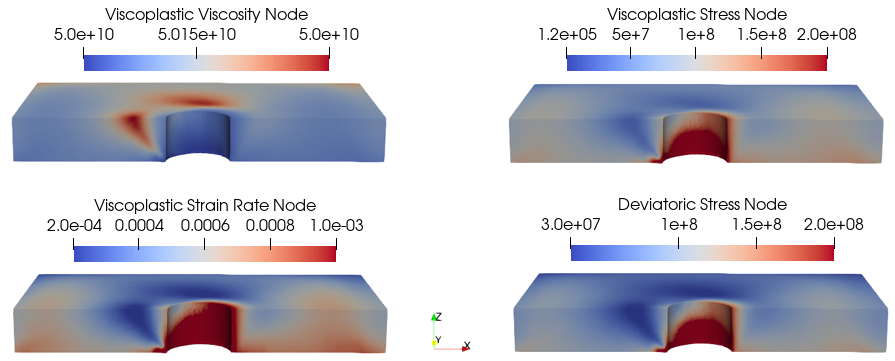
Various contour plots of viscoplastic parameters (e.g. viscosity, stress, strain rate) and deviatoric stress in the salt layer #2 at final configuration
The contour plots of the deviatoric strain and viscoplastic strain in the salt layer #2 at final configuration are shown below. It is worth noting that comparison of the two strain plots show that the viscoplastic strain due to creep in the salt material accounts for less than 10% of the total strain in the model. Hence for this example, the predominant shear behaviour is down to the prescribed bedding plane slip and not salt creep.

Contour plots of deviatoric strain and viscoplastic strain in the salt layer #2 at final configuration
|


