Step06 Forward Simulation
The present workflow step demonstrates the usage of facies during forward simulation. In the same manner as in restoration, Facies_definition is required to assign Material_data to facies ID numbers. Then a Spatial_grid at each deposition stage is used to define the facies distribution for the deposited formation and Geostatic_data defines the initial depositional porosity distribution with depth.
The data files for forward simulation are provided in Geol_002b\Case02\06_Forward_Sim\Data. Those files are:
1.Geol_002b_Case02_fsim.dat main datafile for the forward simulation.
2.Geol_002b_Case02_rest_formation01.geo initial geometry (last geometry file obtained from restoration)
3.Geol_002b_Case02_fsim_geostatic.dat datafile with geostatic data on a facies basis including compaction trends for the different facies.
4.Geol_002b_Case02_RestSurf01.dat file with the sedimentation surface (restoration surface in restoration)
5.Geol_002b_Ss_Si_Sh_Ca.mat file containing the material data for the forward simulation
6.Geol_002b_Case02_fsim_sides.dat datafile containing the geometry sets for the side boundaries
7.Geol_002b_Case02_rest_Disp_formationNN.spat files containing the spatial grids (output from restoration) with the boundary displacements for all stages where NN is the formation number being deposited on such stage.
8.Geol_002b_Case02_rest_Fac_formationNN.spat files containing the spatial grids with the facies distribution for formationNN (output from restoration).
Facies definition
|
Sedimentation
At each sedimentation stage, in order to define the facies distribution for the deposited unit it is required:
1.Definition of the Spatial_grid_facies keyword within Sedimentation_data, which defines the name of the facies distribution spatial grid 2.Definition of the assigned Geostatic_data on a facies basis. It is expected that this data will be identical for all sedimentation stages.
|
Results
The results for the forward simulation are provided in Geol_002b\Case02\06_Forward_simulation\Results. Note that only a selection of results are provided.
By loading the file Geol_002b_Case02_fsim.xmf in ParaView the full series of output plot files (.plt files) can be visualised (in this case the ones provided).
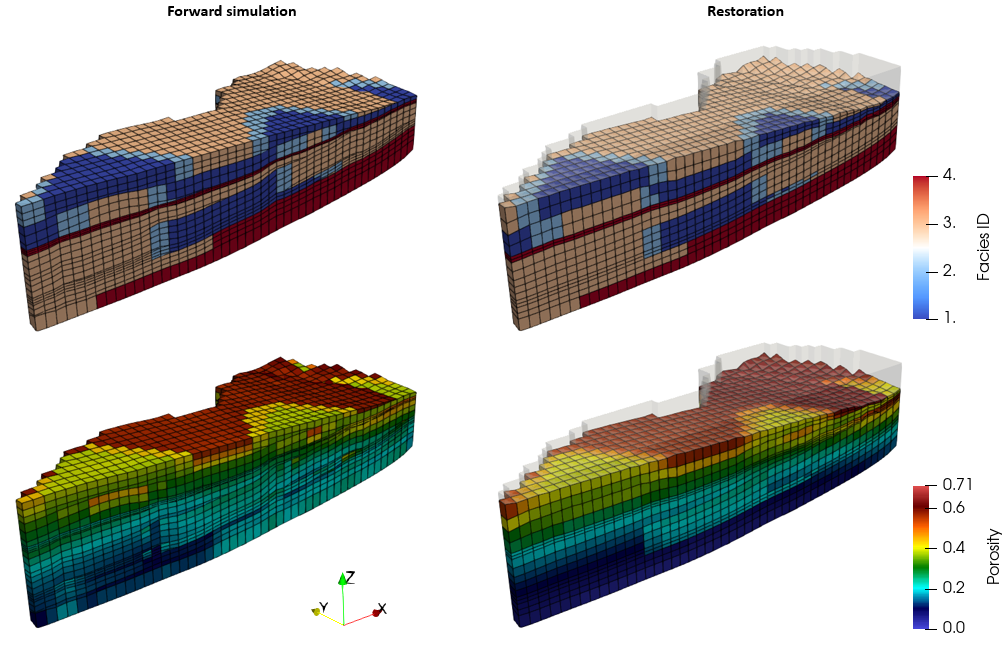
In the figures below comparison of facies and porosity distribution at the end of deposition of formation08 (time 96) is compared to its corresponding state in restoration (end of flattening of formation09). Note that small differences in facies distribution are observed which are attributed to the small deviation in cell locations between restoration and forward simulation leading to different facies ID assignment from the mapping for some cells. The differences in porosity are attributed to the different assumptions between restoration and forward simulation (e.g. in restoration materials are elastic and decompact following the normal compaction trend, whereas in forward simulation the materials are plastic and overpressure may develop leading to undercompaction).
Comparison of facies and porosity distribution between forward simulation at the end of deposition of formation08 and corresponding state in restoration (end of flattening of formation09)
|

