Case01 Four layers with kerogen 'B' and Strength update factor
The present case is a variation of the base case data with the first four layers in the column model containing kerogen 'B'. This example demonstrates the influence of the different strength update factors due to porosity change from the hydrocarbon generation. Where specific hydrocarbon maturation data are not defined, default parameters and settings are applied (default parameters are described in the reference manual Hydrocarbon maturation). In the context of this example, the default settings include:
•Thickness of the kerogen generative layer is the full formation layer.
•Porosity is updated due to hydrocarbon generation.
•A strength update factor fφ of 0.5 is applied to the weakening/reduced strength of the rock material - achieved by reducing the pre-consolidation pressure pc proportional to the change in porosity (Δϕ) using the plastic hardening curve defined for the SR4 material, i.e. Δpc = Δϕ*fφ.
It is recommended to undertake the base case Case00 beforehand. The data is identical to the base data with the addition of data relevant to hydrocarbon maturation. Only these additional data will be described here. Three sub-cases of the strength update factor are investigated and presented here - default factor of 0.5, 1.0 and 0.0. The data files for the project are in : Kin_001\Case01\Data:
•Case01a - strength update factor of 0.5 (default).
•Case01b - strength update factor of 1.0.
•Case01c - strength update factor of 0.0 (i.e. the porosity change due to hydrocarbon expulsion does not contribute to a reduction in strength of material).
Hydrocarbon Maturation Data Definition
The data structures relevant to the definition of hydrocarbon maturation are: •Group_data (only if pre-existing sediment contains kerogen) •History_point to output hydrocarbon kinetics state variables •Sedimentation_data (only required to be defined for deposition layers containing kerogen)
|
Hydrocarbon maturation data is defined by Hydrocarbon_kinetics and Kerogen_kinetics.
Hydrocarbon_kinetics •Defines the assignment and processing data associated with hydrocarbon kinetics, e.g. vitrinite maturation, oil -> gas cracking and hydrocarbon expulsion.
Kerogen_kinetics •Defines the assignment and processing data associated with kerogen kinetics property name "kerogen1" for kerogen 'B' and "kerogen2" for kerogen 'F' (note that for this Case01 example, kerogen2 data is not utilized). •Depending on the kerogen organofacies type defined, different default parameters are defined for transformation index (TI), hydrocarbon index (HI), gas concentration ratio G and weight fraction of carbon W.
|
|
History Section Line Data •The additional data to output in the history section line data is the hydrocarbon kinetics state variable for the kinetics transformation ratio "K_KTR".
History Point Data •History point data sets 1 and 2 are defined for the four layers which contain kerogen, i.e. layers 1- 4. The history point data set ID is incremented with each pair of definition in the stages. •The additional data to output is a list of 13 hydrocarbon kinetics state variables. This is only added to the second set of history point data defined in each of the four layers/stages.
|
•The additional data to include in the sedimentation data for the first three deposition layers is the assignment of the applicable kerogen property set. In this example, the three deposition layers are defined with the same kerogen type as in the pre-existing layer, i.e. kerogen kinetics property set "kerogen1" with organofacies type 'B'.
|
The result files for the project are in directory: Kin_001\Case01\Results. Results of the high definition history files for the output variables including the hydrocarbon kinetic state variables have been processed into the excel file 00_Kin_001_Case01_Results.xlsx. Some of the graphical plots are presented here for the three sub-cases of strength update factor investigated. In the main, the results of Case01a are presented where results for Case01b and Case01c are similar. Where these results differ, comparison plots are presented to show the influence of the different strength update factors. The base case with no kerogen (Case00) is included in these comparison plots for reference.
•Case01a - strength update factor of 0.5 (default). •Case01b - strength update factor of 1.0. •Case01c - strength update factor of 0.0 (i.e. the porosity change due to hydrocarbon expulsion does not contribute to a reduction in strength of material).
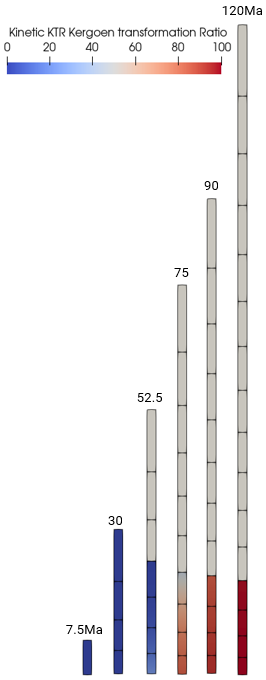
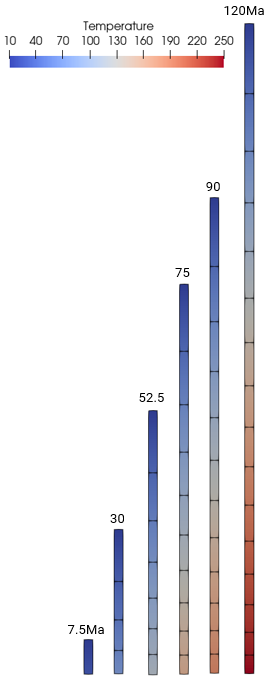
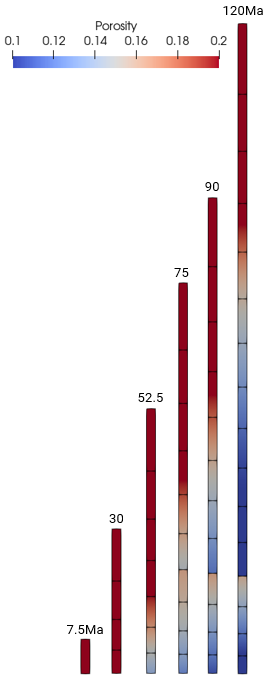
The figures below show the evolution of Kinetic KTR (Kerogen Transformation Ratio), temperature and porosity in the sedimentation column through time. Observed in the plot of Kinetic KTR are the beginnings of kerogen transformation at the base of the column at time 52.5Ma which has a temperature of 115°C. This correlates to the known threshold temperature for oil expulsion for kerogen 'B' which occurs at 110°C (Pepper and Corvi (1995b)). Note that the porosity plots are shown for Case01c with strength update factor of 0.0. This case shows the greatest impact on porosity change with no reduction in strength of material. The upper scale of the contour key is capped at 0.2 to highlight the porosity change in the four kerogen layers.
The figures below show history plots at a point on the base of the column for hydrocarbon generation, retention and expulsion profiles for kerogen 'B'. These are overlaid against the reference Pepper and Corvi (1995b) results which shows excellent correlation.
Case01a: Evolution of Hydrocarbon Generation, Retention and Expulsion Profiles with Temperature at History Point Located at Base of Column for Kerogen Type 'B' (Overlaid against Pepper and Corvi (1995b))
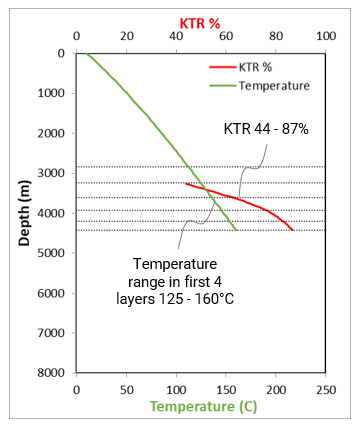
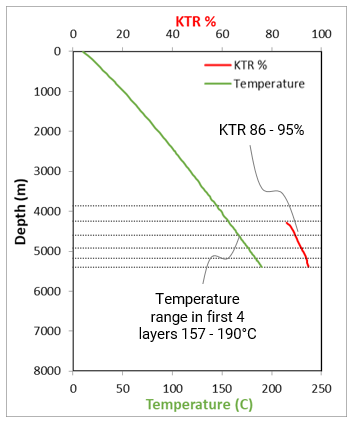
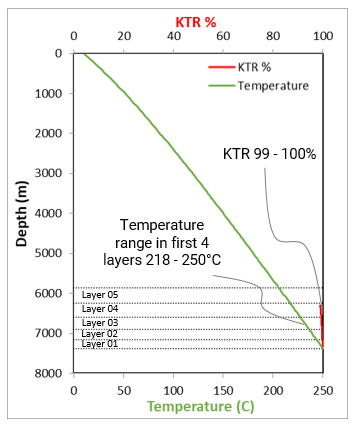
The figures below shows the Kinetic KTR and temperature in the four kerogen layers at various times. Of the three plots, the largest range of transformation (KTR 44 - 87%) occurs at t=75Ma with the temperatures in the kerogen layers between 125 - 160°C. This correlates with the plots above where the amount of hydrocarbon generation and expulsion is greatest in this temperature range. At t=120Ma, almost all the kerogen has been transformed.
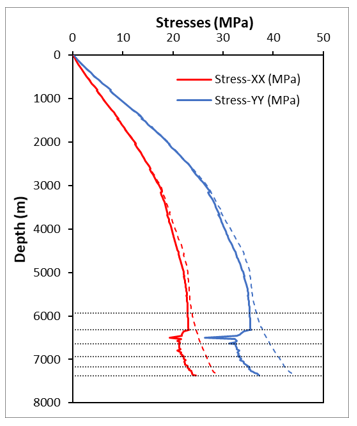
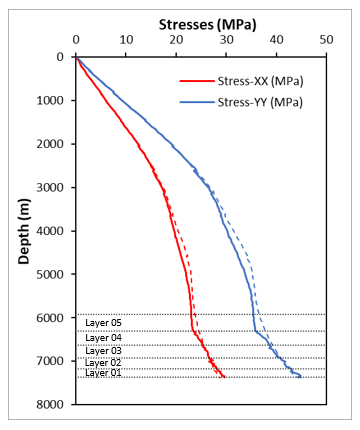
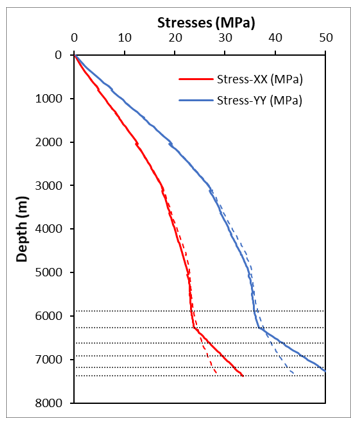
As expected, the strength update factor comparison plots of horizontal and vertical stress distribution as a function of depth at the end of the simulation (t=120Ma) shows the most impact of strength reduction for Case01b which has a strength update factor of 1.0 and the least/no impact for Case01c with a strength update factor of 0.0 with the default 0.5 factor sandwiched in between. In other words, for Case01b, 100% of the porosity change due to hydrocarbon expulsion contributes to the reduction in strength of the four kerogen layers resulting in reduced stresses.
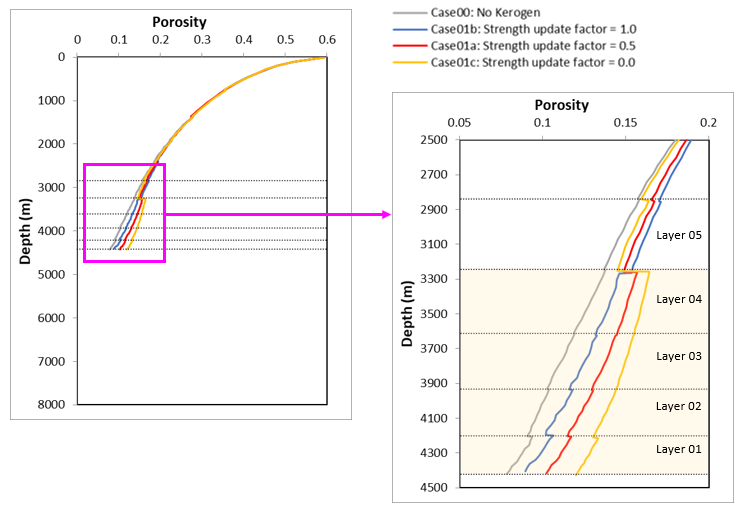
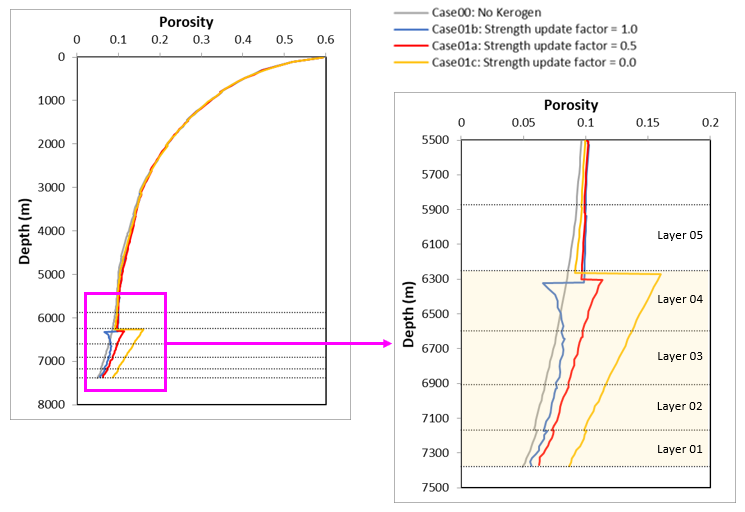
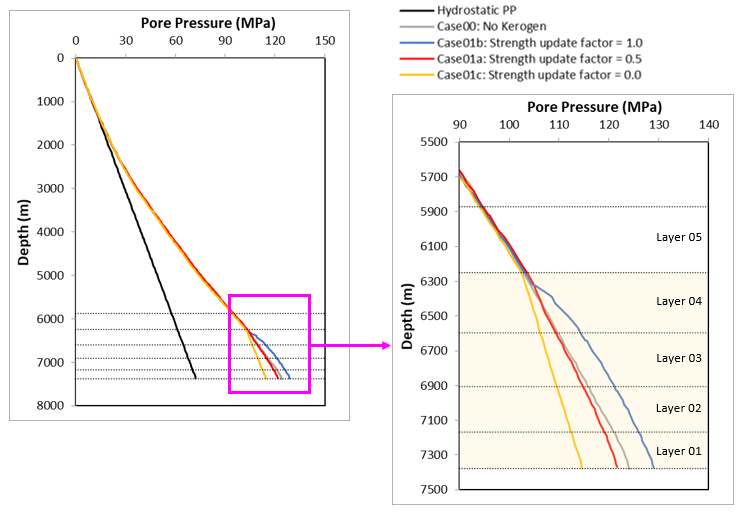
The strength update factor comparison plot for porosity shows the largest porosity increase due to kerogen -> hydrocarbon transformation for the strength reduction factor fφ = 0.0 case; i.e. no reduction in the pre-consolidation pressure (Pc) due to porosity increase. With fφ > 0.0, the impact increases with the magnitude of the strength factor and is therefore largest for fφ = 1.0 case, where full reduction in pc is applied. pc reduction allows for further compaction of the material which in turn leads to decreasing porosity, decreasing permeability and an increase in pore pressure. The influence of further compaction is evident in the plot of porosity at t=120Ma - the reference level for the no kerogen case for the top of layer 4 is shown in dotted lines, the blue line corresponding to fφ = 1.0 shows the most further compaction, then the red line with default factor fφ = 0.5 and least with fφ = 0.0 shown by the orange line. With fφ = 0.0 case where no weakening of the material takes place, the porosity increase from the hydrocarbon expulsion result in an increase in permeability thus lowering pore pressure. Note that the porosity-perm curve is based on the Power law (n=5, A=2E-16) as described in Kin_001.
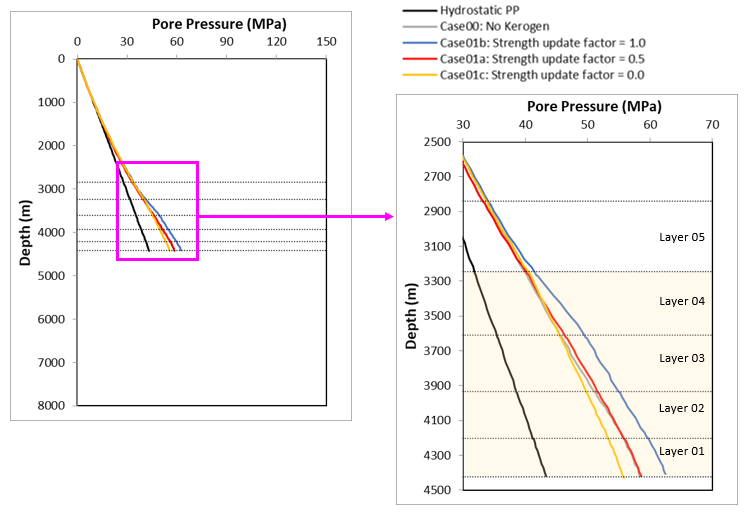
In the next comparison plot for pore pressure, the highest overpressure is observed for fφ = 1.0 case, followed by fφ = 0.5 case and then the fφ = 0.0 case, the latter two pore pressures dropping below the reference no kerogen case. As mentioned, depending on the impact of the increased porosity on the formation permeability, and the amount of strength reduction applied, the porosity and pore pressure in the kerogen layers could fall below or above the reference no kerogen case.
|
|||||||||||||||||||||||||||||||||||||||||||||||||||||
[1] Pepper, A.S. and Corvi, P.J. (1995(a)): Simple kinetic models of petroleum formation. Part I: Oil and gas generation from kerogen. Marine and Petroleum Geology. 12(3) 291–319. 1995(a). [2] Pepper, A.S., Dodd, T.A. (1995): Simple kinetic models of petroleum formation. Part II: Oil-gas cracking. Marine and Petroleum Geology. 12(3) 321-340. [3] Pepper, A.S. and Corvi, P.J. (1995(b)): Simple kinetic models of petroleum formation. Part III: Modelling an open system. Marine and Petroleum Geology. 12(4) 417-452.
|

