Case04 HM Coupled Producer and Injector Wells
For the present tutorial example it is recommended to undertake the following example beforehand:
1MEM_001 Case03a HM Coupled (High Perm Fault).
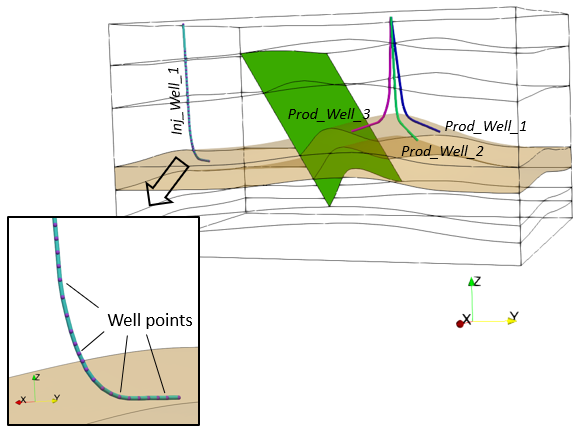
The present case is a variation of the HM coupled MEM example MEM_001 Case03a with the inclusion of an injector well 1 on the south-side of the anticline and utilising depth dependent normal and tangential contact flow models. Injection of the reservoir layer from injector well 1 is modelled via well element definition data structure Well_element using prescribed surface (pore) pressure loading. Injection from injection well 1 starts after 11 days of drawdown from the producer well 3. The simulation models a total of 101 days of drawdown/depletion from producer well 3 and 90 days of injection from injector well 1 (see picture below).
Note that the simulation run completes in 1.6 hrs on a 3.6 GHz AMD processor machine.
(An equivalent Case04 coarse mesh model (mesh as used in Case01) is also provided in MEM_001\Case04_coarse. This can be used to familiarise with the workflow. The simulation run completes in 10 minutes).
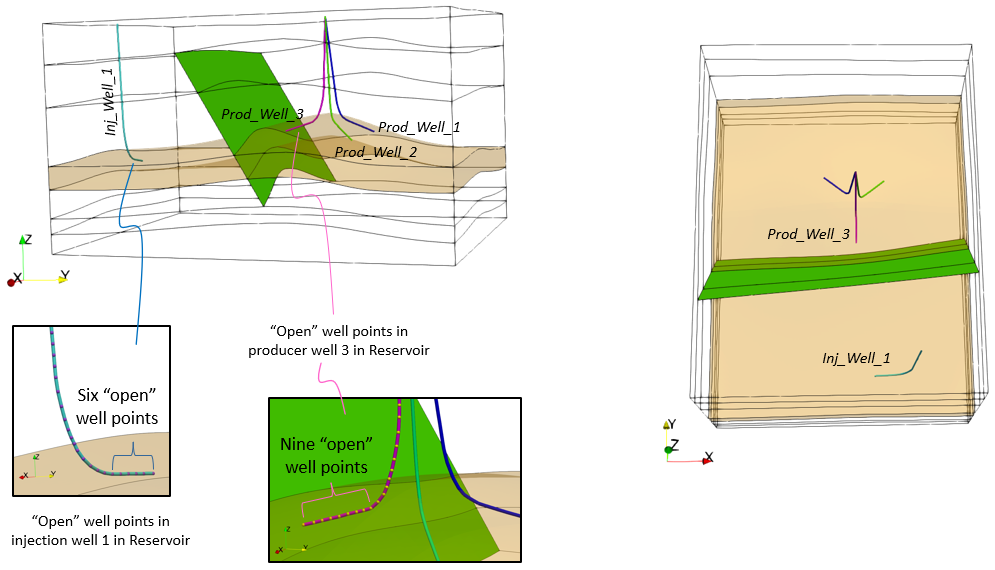
MEM Model with injector and producer wells
The data files for the project are in: MEM_001\Case04\Data. The data comprises:
1.geostatic.set: Settings file with pre-defined Geostatic_control_data sets that can be read from the main problem data file. Generally this file is stored in the PARAGEOHOME directory (directory of ParaGeo executable) and is provided here for reference. Note that if a copy of the file is also stored in the simulation directory this will take precedence over the copy stored in PARAGEOHOME directory.
2.MEM_001_Case04.dat: Main problem data file.
3.MEM_001_Case04_Fine_mesh.geo: Geometry and mesh for the problem with finer mesh discretisation of the reservoir layer 4.
4.MEM_001_Case04.geometry: Data file with definition of geometry sets and groups for the problem including the active groups in the porous flow field and fault contact names.
5.MEM_001_Case04.contact: Data file with definition of contact, fault and fluid flow contact data for the problem.
6.MEM_001_Case04.mat: Material file including Material_data with permeabilities for all lithologies and Fluid_properties.
7.MEM_001_Case04_Porosity.spat: File containing a Spatial_grid with the initial element porosity values for all formations.
8.MEM_001_Case04_node_PP_Initial.spat: File containing a Spatial_grid with the initial nodal pore pressure values for all formations.
Simulation Stages
A summary of the simulation stage durations and termination times for this example is shown in the table below.

Simulation stage durations and termination times
The initialization stages 1 - 4, with 1 day duration each, are the same as MEM_001 Case03a and will not be described here.
Stage 1: Elastic Gravity Initialization
Stage 2: Tectonic Displacement
Stage 3: Contact Release
Stage 4: Constitutive Release
After initialization, the model simulates a total of 101 days of drawdown/depletion and 90 days of injection spread over three stages. The first of these three stages is to model the start of flow with the application of the drawdown pressure ramp over a 1 day duration and simulated with smaller time increments to better capture the high drawdown pressure rates. This is then followed in the next stage by 10 days of depletion flow at constant drawdown before the final stage with combined injection and depletion flow. In all these stages, the pore pressure loading is defined with a prescribed well surface pressure loading using the Well_definition data structure with corresponding Time_curve_data. The three depletion and injection stages are summarised below.
Stage 5: Drawdown/Depletion - Start of Flow
•Producer well 3 comes online in this stage with a prescribed well surface pressure of 20·106 Pa which is linearly ramped down to 0 Pa over a 1 day time period via Well_definition data structure and corresponding Time_curve_data. Note that this surface pressure value is defined in line with the initial overpressure of 20 MPa in the reservoir (formation04) layer which was previously defined via spatial grid nodal pore pressures. This surface pressure is then subsequently depleted down to reservoir pressure (i.e. zero overpressure) over a 1 day time period. Note that the initial pore pressure in the whole reservoir layer is in the range 34·106 - 69·106 Pa with pressures in the range 47·106 - 51·106 Pa around the producer well 3 "open" locations.
Stage 6: Depletion Flow - Constant Drawdown
•The zero well surface pressure in producer well 3 is maintained over a 10 day time period.
Stage 7: Combined Depletion and Injection Flow
•Injector well 1 comes online in this stage with a prescribed well surface pressure of 20·106 Pa which is linearly ramped up to 30·106 Pa over a 2 day time period and maintained constant thereafter for the remaining duration. This loading is via Well_definition data structure and corresponding Time_curve_data. This represents an imposed injection pressure (above initial pore pressure) of c.a. 10·106 Pa for those 'open' injector well points.
Note that only key data structures and those different to that used in MEM_001 Case03a are described for this example.
Contact and Fault data
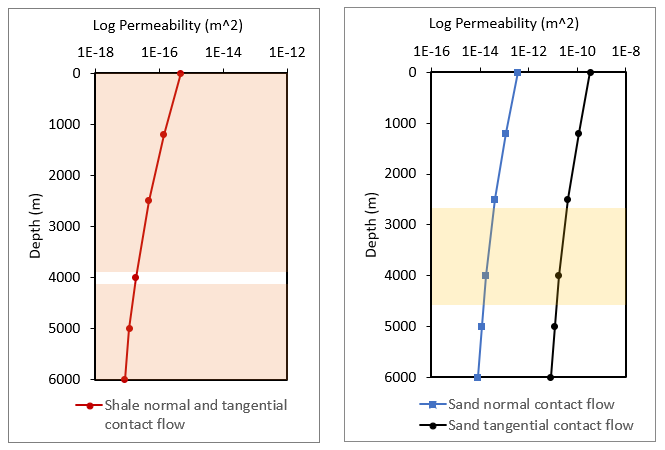
Depth dependent normal and tangential contact flow intrinsic permeabilities are defined for the shale and reservoir sand layer, with the deeper layers having less permeable flow (see picture below). In reality, at lower depths, rock material tend to be cemented with less pores and have lower perm in the faults. The intrinsic permeabilities for the shale at the various depths are defined c.a. 1·10-3 times and 1·10-6 times lower than the sand for the contact normal flow and contact tangential flow intrinsic permeabilities, respectively.
Note that contact and fault data are defined in a separate file named MEM_001_Case04.contact which is included in the main data file using the command Include.
Intrinsic perm vs depth table for contact normal flow and tangential flow for shale and reservoir sand. Coloured bands represent relevant depths for shale and sand layers in the example model.
|
Well Element Definition Data
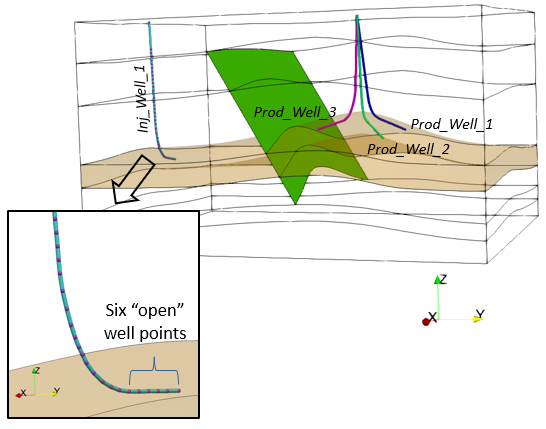
Data definition for the additional injector well is described here. Note that injector well #1 will not come online until stage 7, however, it is recommended that the well is defined in stage 1 with the well points 'shut' and then updated to 'open' when they come online in the later stage. This enables the user to visualize and track the well throughout the simulation.
Note that when the well loading is defined with Surface_pressure, care must be taken to ensure that when the well comes online, the value of the pressure defined is in line with initial conditions.
|
Stages 5 - 7: Drawdown/Depletion and Injection Flow Stages
The stage 5 drawdown/depletion data are the same as in MEM_001 Case03a and will not be described here. Only key data for stage 6 depletion and stage 7 combined depletion and injection flow data will be described.
Injection data
Injector well 1 comes online in stage 7. The well data previously defined in stage 1 still applies and the re-definition of the well data need only consist of the name of the well, the status distribution (and well loading time curve if different from previously defined). In this case, only the status distribution for the six well points in the reservoir (formation04) layer is changed from "shut" to "open" for injector well 1. Note that the injector well 1 was previously prescribed in stage 1 with a surface pressure loading ramped up from 20·106 Pa to 30·106 Pa over a 2 day duration and maintained constant thereafter.
Stage 7 simulates the injection flow combined with depletion flow. Note that the time step increment in the solution control stage is defined as 1.0. This is half that of the 2 day ramp up time for injection flow and as such, a coupling step will be performed within the ramp up time.
Solution control data for Depletion Flow (Stage 6)
Solution control data for Combined Depletion and Injection Flow (Stage 7)
|
Results
The results for the project are located in MEM_001\Case04\Results. In this directory the spreadsheet 00_MEM_001_Case04_Results.xlsx contains all the processed history results output from the simulation.
The figures below show a comparison of results with depletion only (Case03a) and with combined depletion and injection flow (Case04) for distribution of change of displacement in the model and subsidence on the top surface. The results show that the introduction of injection has reduced the overall subsidence in the model and on the top surface.
(a) Change in displacement and locations of producer and injector wells
(b) Subsidence on top surface
Comparison of results with depletion only (Case03a) and with combined depletion and injection (Case04) for distribution of change in displacement and top surface subsidence at the history section lines "SubsidenceX" and "SubsidenceY".
The figures below show a comparison of results with depletion only (Case03a) and with combined depletion and injection flow (Case04) for non-linear contact slip, pore pressure, change in vertical stress and porosity in the reservoir. Locations of producer and injector wells are incorporated in the figures for reference. For Case04, the elevated pore pressures on the south-side of the anticline in the reservoir layer due to injection has lead to increased tensile stresses and consequent increase in porosity. Note that the contour key ranges for the two cases have been set consistent for all the variables in order for a like-for-like comparison.
(a) Case03a: Depletion only
(b) Case04: Combined depletion and injection
Comparison of reservoir results for (a) Case03a - depletion only vs (b) Case4 - combined depletion and injection for contact plastic slip, pore pressure, change in vertical stress and porosity. Reference locations of producer well 3 (pink) and injector well 1 (cyan) are also shown.
The figures below show a comparison of results with depletion only (Case03a) and with combined depletion and injection flow (Case04) for horizontal and vertical displacements and the displacement change in the reservoir layer. The introduction of injection has resulted in an increased magnitude in y-displacement towards the producer well in the space between the injector and producer wells. Dilation in the vicinity of the injector well is also observed.
(a) Case03a: Depletion only
(b) Case04: Combined depletion and injection
Comparison of reservoir results for (a) Case03a - depletion only vs (b) Case4 - combined depletion and injection for displacements in the horizontal and vertical directions and displacement change. Reference locations of producer well 3 (pink) and injector well 1 (cyan) are also shown.
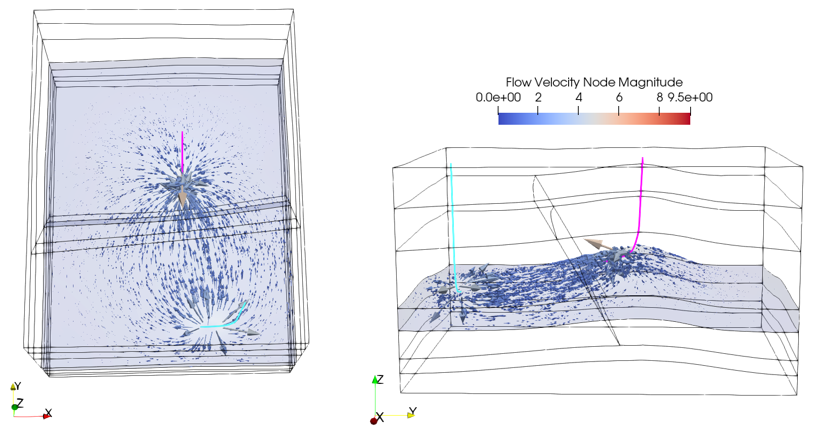
The figures below show the flow velocity vectors in the reservoir layer. This clearly shows the "pushing" away of flow from the injector well towards the producer well which is "drawing in" flow up the well. This response is in line with what was observed with the displacements shown above.
Flow velocity vectors in the reservoir layer with locations of producer well 3 (pink) and injector well 1 (cyan).
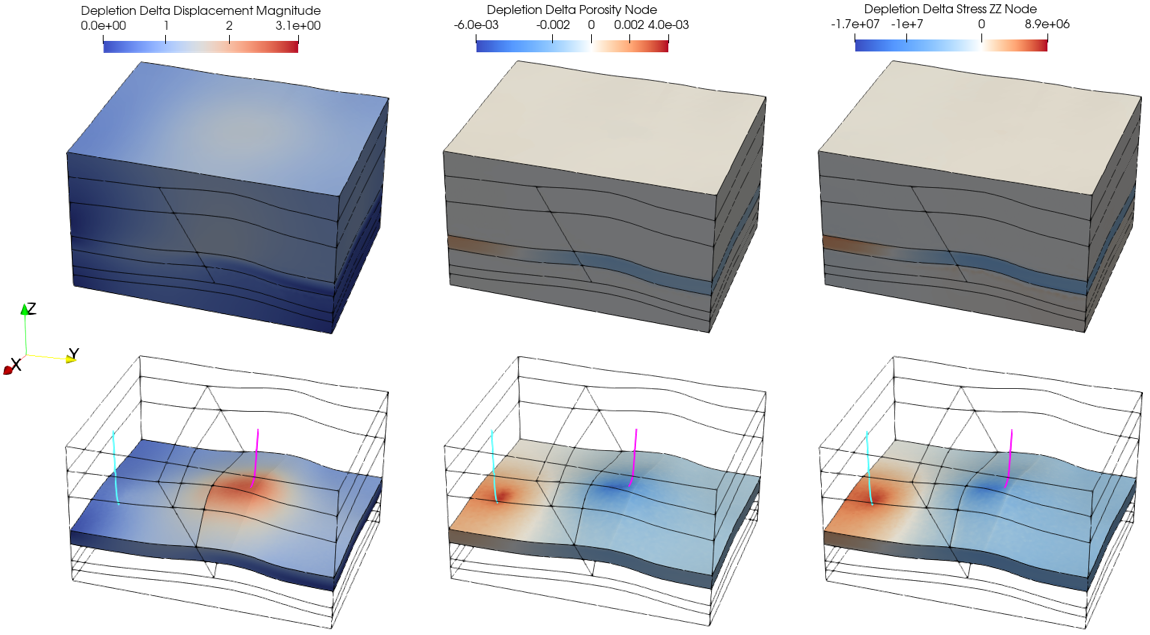
In the figures below, distribution of displacement change, porosity change and vertical stress change at the end of combined depletion and injection are shown. Note that the change for horizontal stresses is not shown as it is not significant for the present case. Note also that these changes have been output because of the definition of the Reference_set_data. As expected, the drawdown at producer well 3 in the reservoir has led to an increase in the vertical effective compressive stress in the vicinity which in turn has led to a porosity reduction due to elastic compaction. The converse is true for the injection at injector well 1 in the reservoir which has led to an increase in the vertical effective tensile stress in the vicinity resulting in dilation and a porosity increase.
Distribution of change in displacement, porosity and vertical stress at the end of combined depletion and injection. The colour scale for plots showing the change in stress and porosity has been set so that the 0 value (no change) is shown in white, negative changes are shown in blue and positive changes in red. Reference locations of producer well 3 (pink) and injector well 1 (cyan) are also shown.
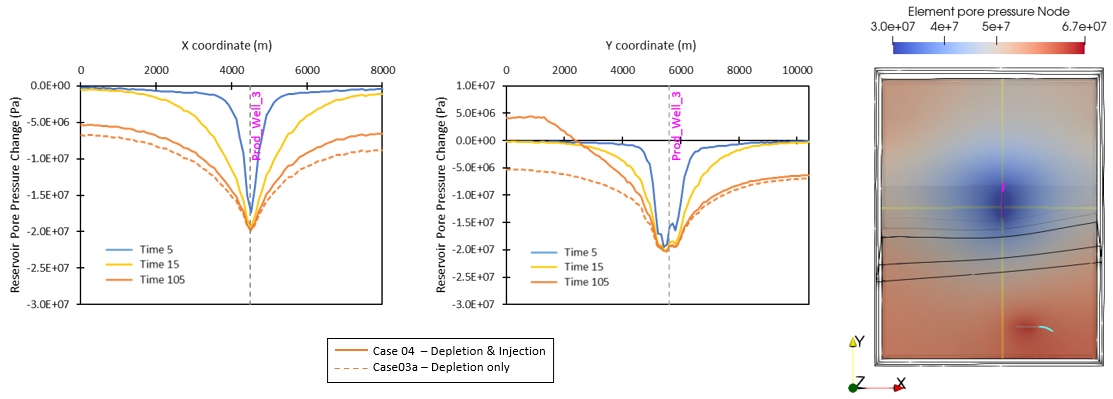
The change in pore pressure in the reservoir at various times along the two history section line sets (yellow lines) are shown in the graph plots below. As can be seen in both profiles the maximum pore pressure change is concentrated at the producer well 3 location (indicated by the vertical discontinuous line) where the nodes are subjected to a prescribed pore pressure of 30·106 Pa. This is also the location of maximum compaction and downward displacement. Note that the plots at times 5 and 15 are for depletion only, injection only commence after time 15 and the plot at time 105 is for combined depletion and injection which shows the elevated pore pressures on the south-side of the anticline where the injector well 1 is located.
Pore pressure change in the reservoir monitored along the two history section line sets (shown in yellow) in the middle of the reservoir layer. The dotted line on the graphs indicate the coordinates where the two section lines cross at the producer well 3 location. Reference locations of producer well 3 (pink) and injector well 1 (cyan) are also shown.
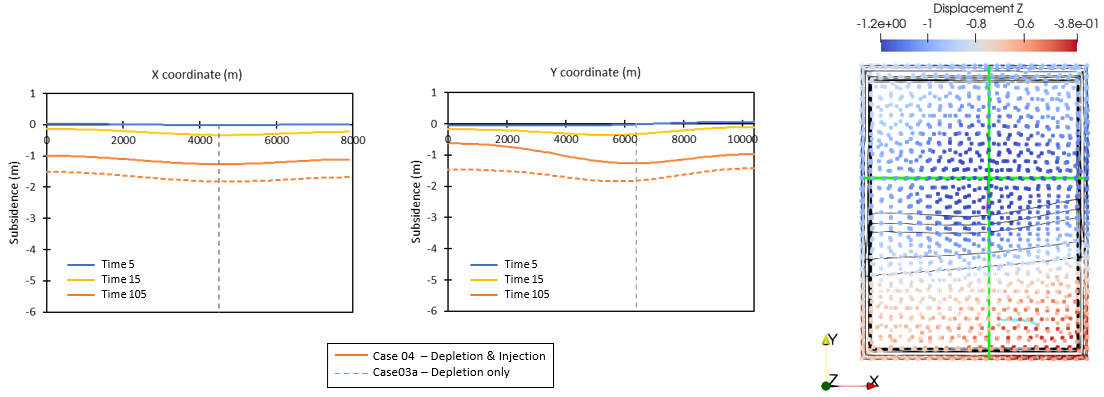
The subsidences at various times along the two history section line sets on the top surface are shown below. As can be seen in both profiles, the subsidence increases with increasing depletion of the reservoir (which lead to compaction and downward displacement). At the end of combined depletion and injection, the subsidence in the south-side of the anticline is higher than in the north-side apart from the region in the south-side around the injector well 1. This is a consequence of the depletion of the reservoir where the maximum pore pressure change and vertical displacement occurs near producer well 3 located on the south-side of the anticline (as shown in the plots above).
Subsidence results monitored along the two history section line sets and vertical displacement at the top surface nodes. The dotted line indicate the coordinates where the two section lines cross (above the anticline crest). In the top surface plot the history section lines are shown in green. Reference locations of producer well 3 (pink) and injector well 1 (cyan) in the reservoir layer below are also shown.
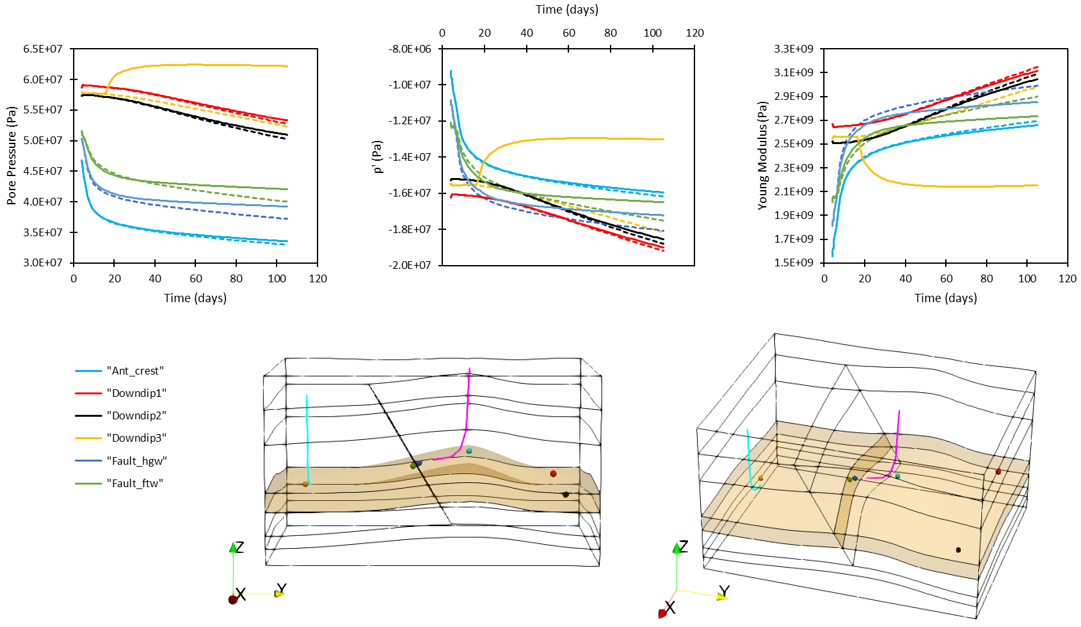
The figures below show comparison plots between the combined depletion and injection (Case04) and depletion only (Case03a) for evolution of pore pressure, effective mean stress and Young's Modulus for the six history points located within the reservoir. With injection (Case04), the trend of the plots at the end of the simulation show an overall increase in pore pressure and effective mean stress at all six history points but with reduced Young's Modulus. Maximum difference between the two cases is observed in "Downdip3" history point location which coincides with the location of the injector well 1.
Pore pressure, effective mean stress and Young's Modulus history results at the six points located within the reservoir. Solid lines in the graph plots are for combined depletion and injection (Case04), dotted lines are for depletion only (Case03a).
|

