GeoInv_002 Pulse Decay Experiment
Experiment Background
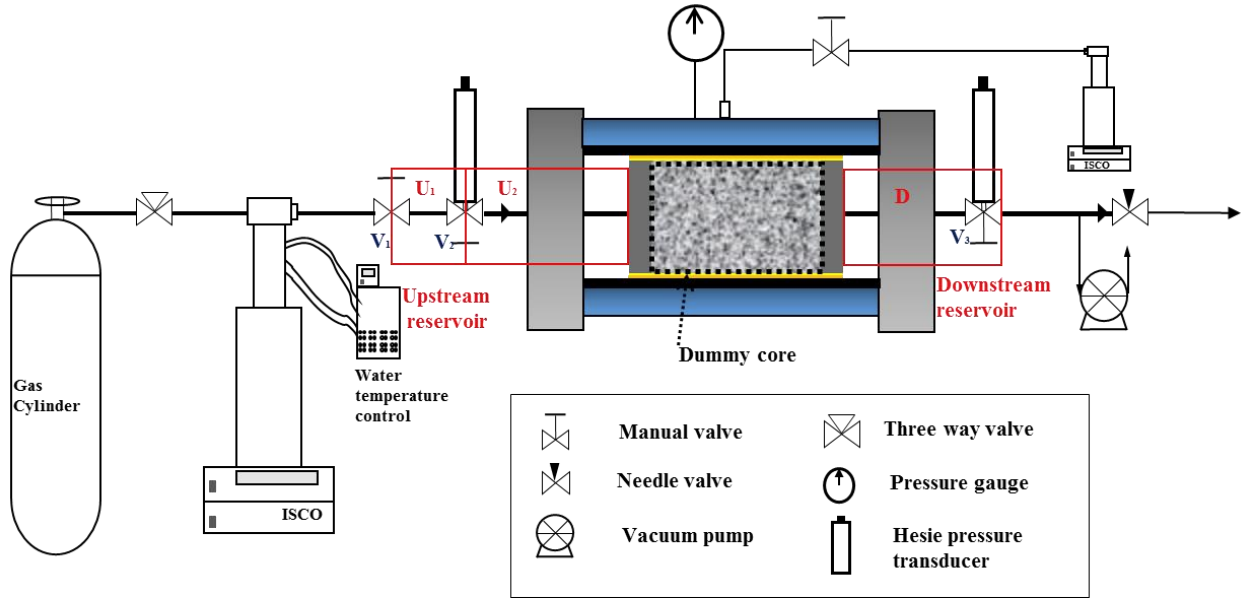
Pulse-decay experiments are routinely used to measure petrophysical properties of tight cores by flowing helium under pressure gradient. The following figure illustrates the pulse-decay experimental set-up (Jia B. et al. 2017). The set-up mainly consists of four components, including first upstream reservoir U1, second upstream reservoir U2, core holder, and downstream reservoir D.
Pulse-decay experimental set-up (obtained from Jia B. et al. 2017)
There are three main stages in the experiment: •Stage 1: Gas injection by constant pressure with valves V1 and V2 opened, and V3 closed. •Stage 2: Pressure pulse introduced into U1 with V2 closed. •Stage 3: V2 is opened and V1 is closed. Pressure equilibrium attained over time.
In gas flow, it is important to account for Klinkenberg effect, in which the slip flow of gas at pore walls enhances gas flow when pore sizes are very small. This causes the measured permeability of gas to be higher than the absolute permeability of the sample. |
Modelling Background and Target solution
The target solution is generated using a ParaGeo simulation which is provided in GeoInv_002\Reference_solution.
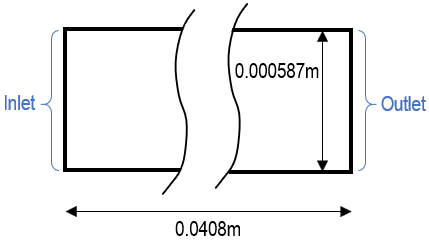
A core sample modelled in 2D with dimension of 0.408m x 0.000587m is prescribed with reservoir volume, pressure and temperature at both ends. The boundary conditions are defined via Supply_reservoir_boundary data structure.
Description of geometry and inlet/outlet boundaries
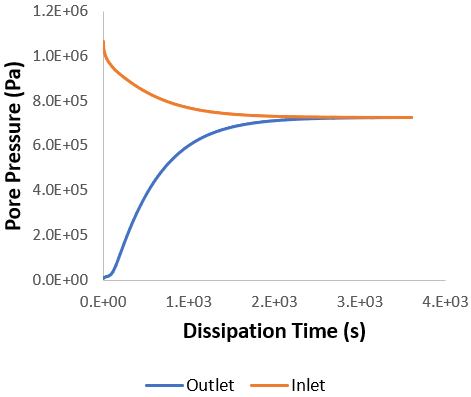
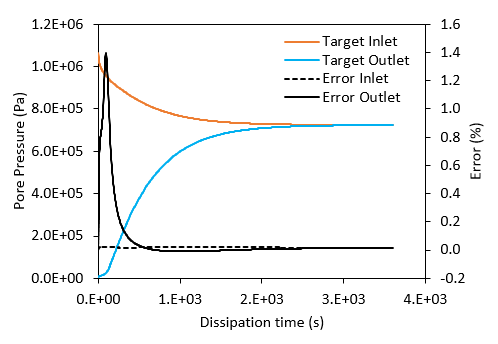
The data file is set for simulation of Stage 3 described in the Experiment Background section above. During this stage, the upstream pressure starts to decline while the downstream pressure rises. As shown in the plot below, when the two pressure curves approach one another, pressure equilibrium across the core sample gradually takes place.
Equilibrium attained over time as two pressure curves approach one another
Pressure distribution over time across core sample
Users may refer to the ParaGeo data file used to generate target solution for more details (GeoInv_002\Reference_solution). In the following, the key properties of core sample and helium gas as well as reservoir boundary supply conditions are tabled.
|
Inverse Analysis data file description (.inp)
In this inverse analysis, the goal is to recover the permeability and Klinkenberg slippage factor of the core sample when using helium gas. The target solutions are the pore pressure evolution at both inlet and outlet of the core. Target solutions were generated from a ParaGeo simulation with the data set following the modelling descriptions above. Template data file, in this particular case, is the same as the target data file. It is used by ParaGeoInv to generate model data files during optimisation process. In the following, we focus on the descriptions of ParaGeoInv data file.
The ParaGeoInv data file for the project is: GEOINV_002\Data\Pulse_decay.dat. The basic data includes: 1Application_data identifies the directory of ParaGeo solver 2Parameter_data sets optimisation parameters, including variable name, initial value, minimum/maximum values, corresponding data structure name and number 3NA_options defines the tuning parameters of Nearest Neighbour algorithm and convergence tolerance. Users are also given flexibility to manage (i.e. keep or delete) the generated test models. 4File_data identifies the directory of template, target and test files. The name of template file is also required. 5Misfit_data_set specifies type of data to be compared between target and model solutions. The computation of corresponding misfit value is based on selected error type. 6Inverse_case chooses misfit data set(s) to be used. This data structure offers to run multiple cases, with the aim of homogenising the same optimisation variable.
Application_data
Parameter_data
NA_options
File_data
Misfit_data_set
Inverse_case
|
Results
The result files for the project are in directory: GeoInv_002\Results.
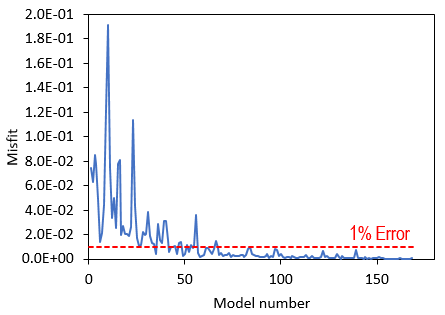
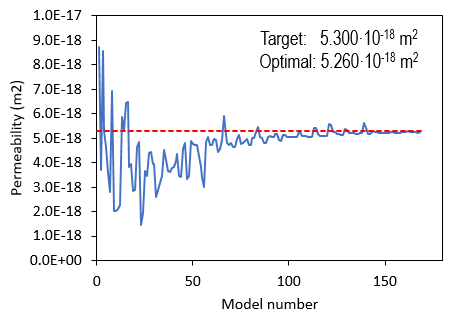
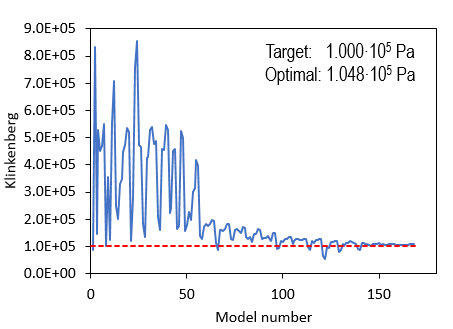
The inverse analysis has finalised after performing 168 model simulations without satisfying the imposed convergence criteria. This corresponds to the initial sample of 8 models plus 20 samples of 8 models each. Hence, for the present case the criteria for finalising the inverse analysis has been to reach the maximum number of samples (set to 20). The best model (model number 161) is reported as the optimal model which has a misfit of 2.25E-04 (with the convergence criteria being 1.0E-4). After such maximum number of samples-triggered termination one may asses whether the optimal model reproduces the target observations with a satisfactory accuracy. As can be seen in the final figure, the found optimal values lead to a solution that has a peak error of c.a. 1.4 % at 92 s in the pore pressure measured at the outlet which may be low enough to be acceptable (this will depend on the purposes).
Misfit Value
Reduction of misfit towards value lower than 1% error
Optimal Permeability
Nearest Neighbour algorithm searching for optimal Young's modulus
Optimal Klinkenberg Slippage Factor
Nearest Neighbour algorithm searching for optimal Klinkenberg slippage factor
Comparison with Target Solution
Low percentage difference in comparison against target solutions
|
References
Jia, B., Tsau, J., Barati, R. 2017. Evaluation of Core Heterogeneity Effect on Pulse-Decay Experiment. 31st International Symposium of the Society of Core Analysts. |

