Val_004c Cook's Membrane
Problem Description
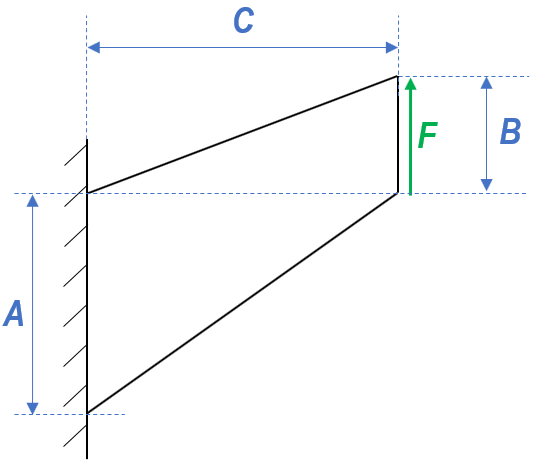
Cook’s membrane is a tapered panel made with rubber-like (nearly incompressible) material. One of its sides is clamped, while the opposite side is subjected to a shearing load F = 0.205 MPa for 2D case and F = 1.5 MPa for 3D case. The membrane deforms under a mixture of shear and bending strains. The plastic deformation is based on von-Mises elastoplastic model. Note that, for 2D cases, plane strain condition is assumed.
|
Mesh Discretisation
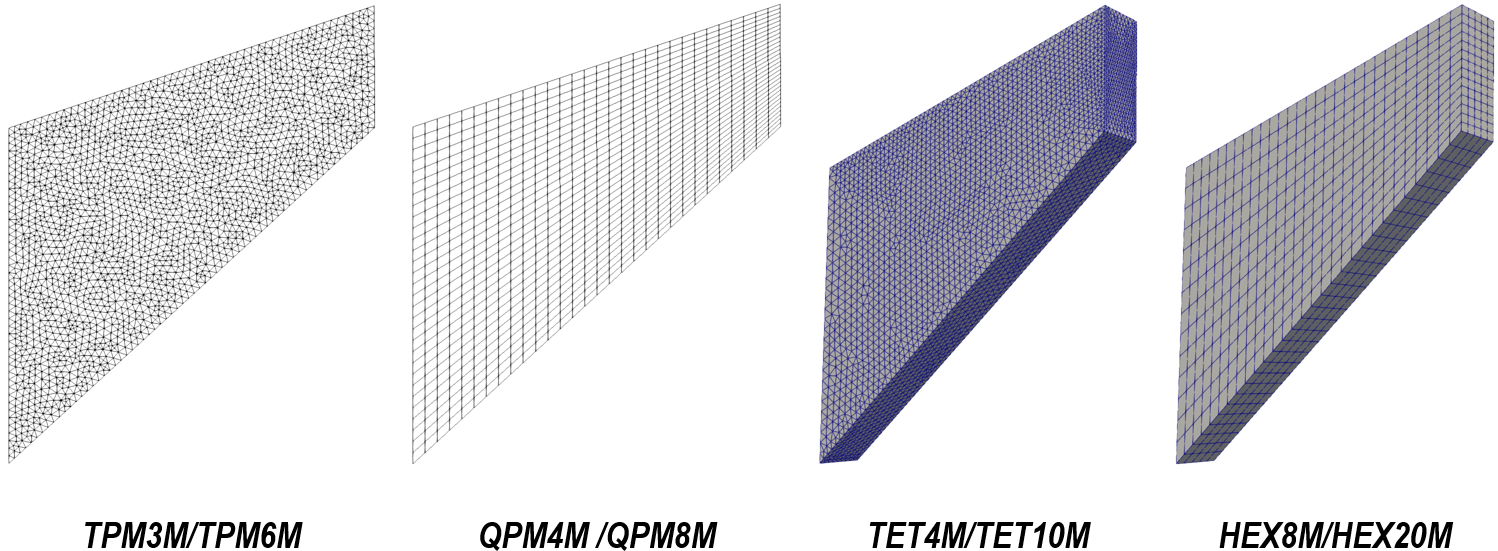
Fourteen element types have been used in this near-incompressibility test case. The followings illustrate some examples of meshed models that have been used in 2D and 3D cases. In general, higher-order elements and elements with mixed formulation are preferred for Cook’s membrane problem.
Example of meshed models for 2D and 3D cases
|
Data File Descriptions
The data files for the different element types are in Val_004\cook. The different cases are in different sub-folders according to the dimensions (2D/3D), solver (explicit/implicit) and element type used for each specific case.
The basic data includes: 1Geometry_data imports geometry file for 3D cases in *.geo format that has been created using Gmsh and made compatible using ParaGeo pre-processing procedures. In 2D cases, the geometry is created directly through data file without the aforementioned pre-processing. 2Geometry_set groups multiple geometry entities under convenient geometry set names. 3Group_control_data activates geomechanical field for the current simulation group. 4Group_data sets the group name, element type, material name, porous flow type and the associated volume entity. 5Material_data defines the material properties of the model. 6Support_data constrains the displacement freedom on each surface accordingly. 7Global_loads defines the prescribed surface tangential load on the geometry set associated with the shearing load. 8Damping_global_data sets a global damping ratio of 2%. 9Control_data defines the solution algorithm (e.g. 1 for explicit transient dynamic algorithm, 7 for nonlinear implicit algorithm), termination time, etc.
Only key data structures are shown below.
Group_data
Material_data
Global_loads
|
Results
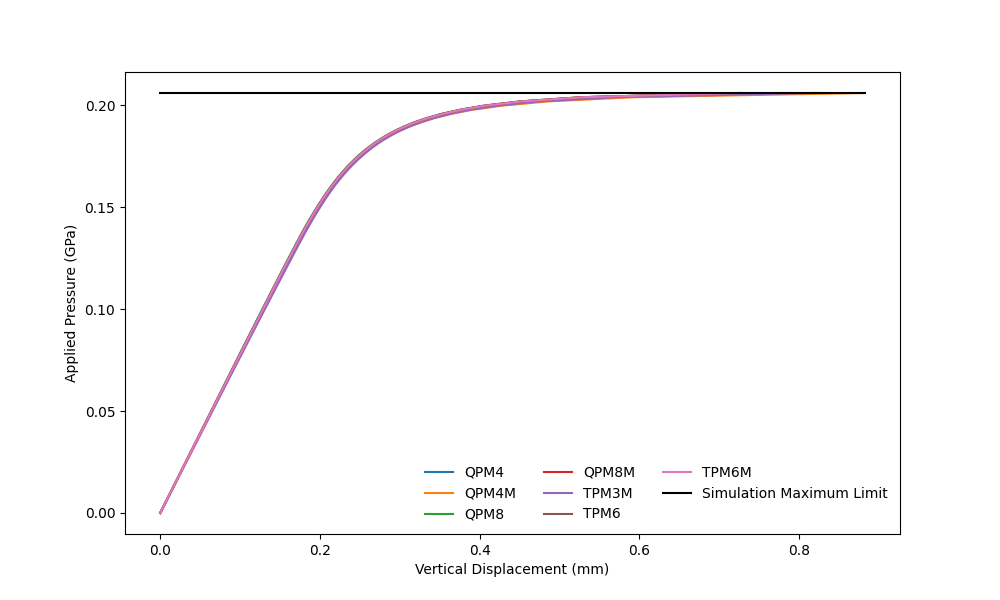
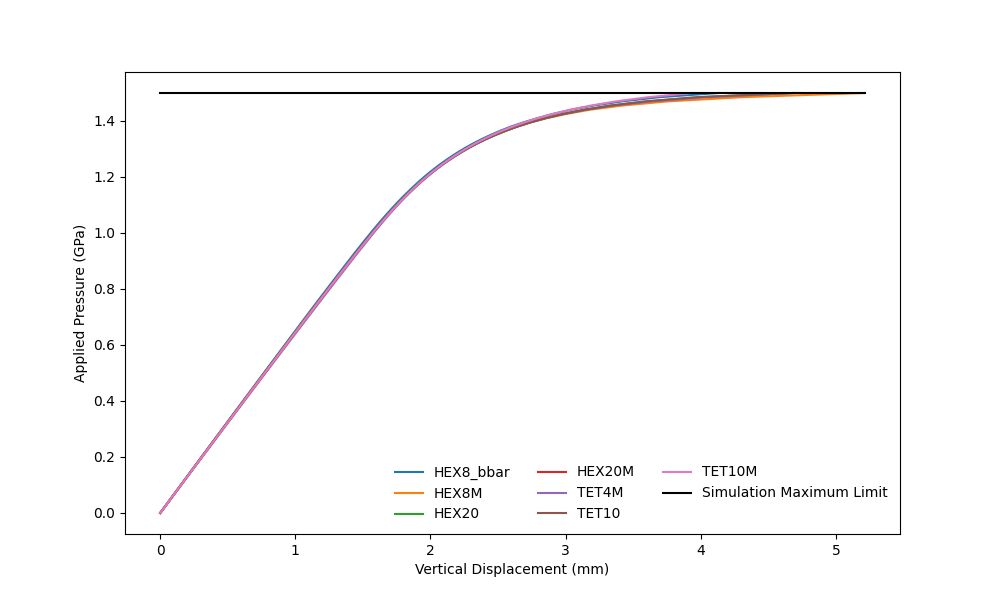
The load-displacement curve for 2D and 3D cases are plotted separately as the former assumes plane strain conditions. Overall, all tested element types approach asymptotically to a pressure value as the vertical displacement is driven by the shear load. The plateau in the plot is the manifestation of plastic collapse, and therefore the corresponding pressure value is treated as the limit load of the Cook’s membrane. Load-displacement curve for Cook's membrane in plane strain condition.
Load-displacement curve for Cook's membrane in 3D.
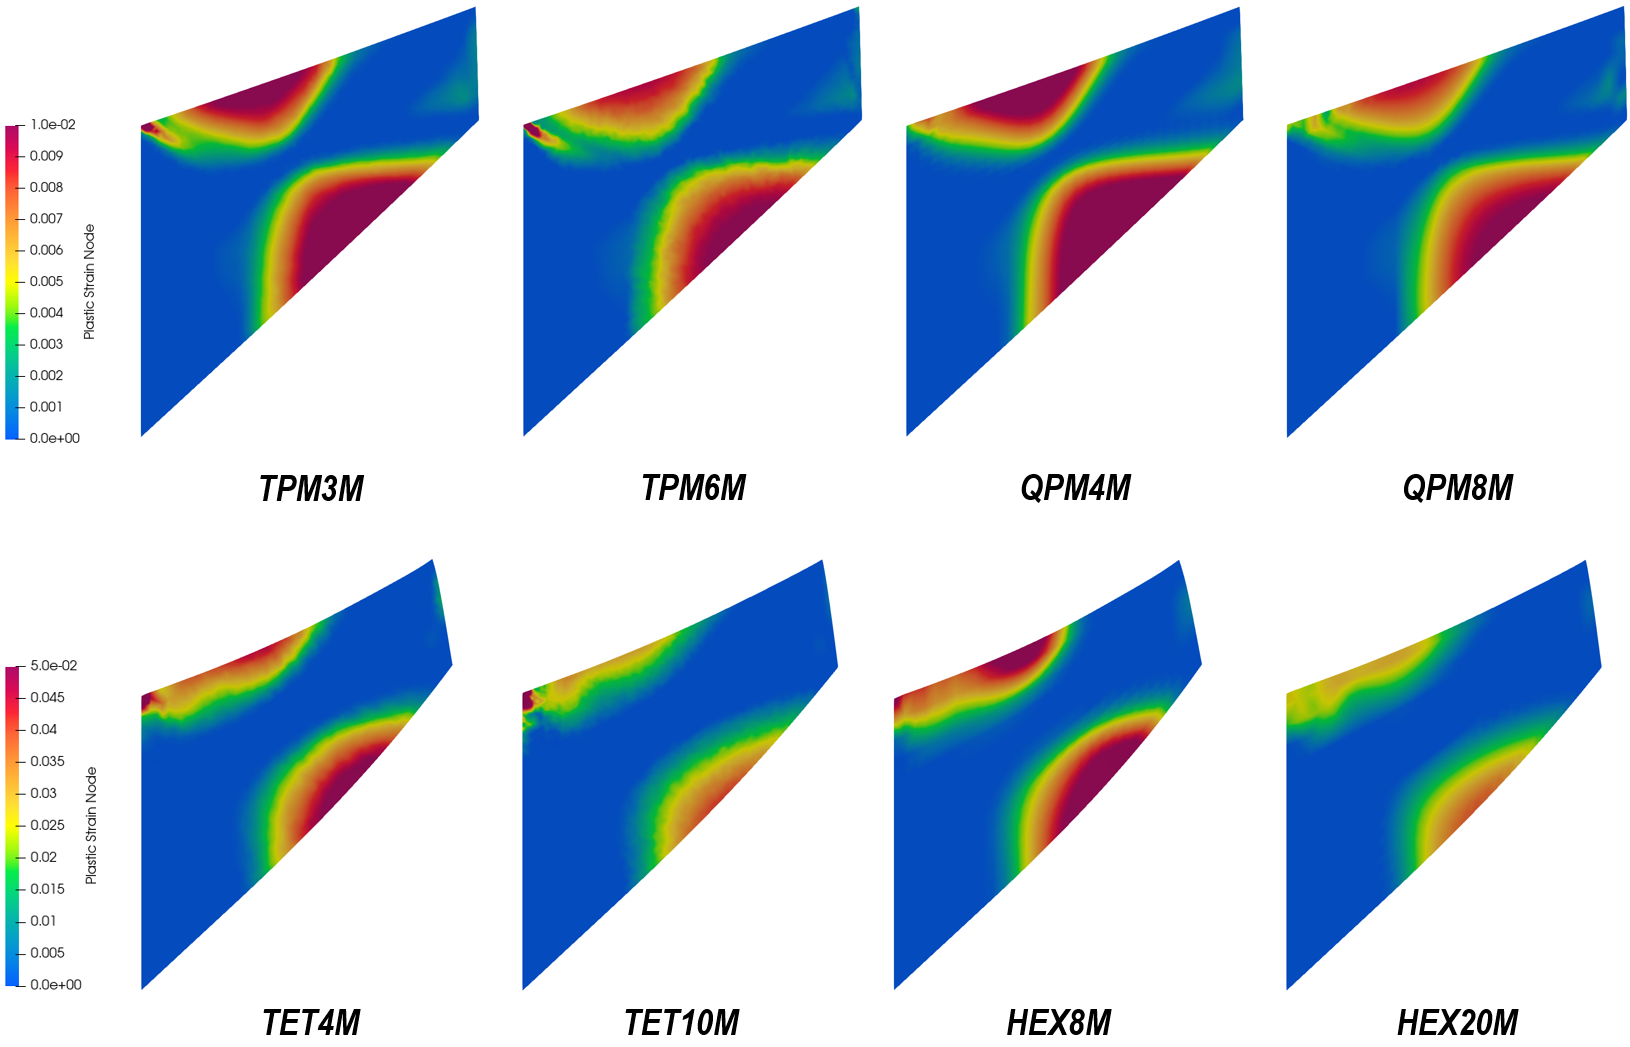
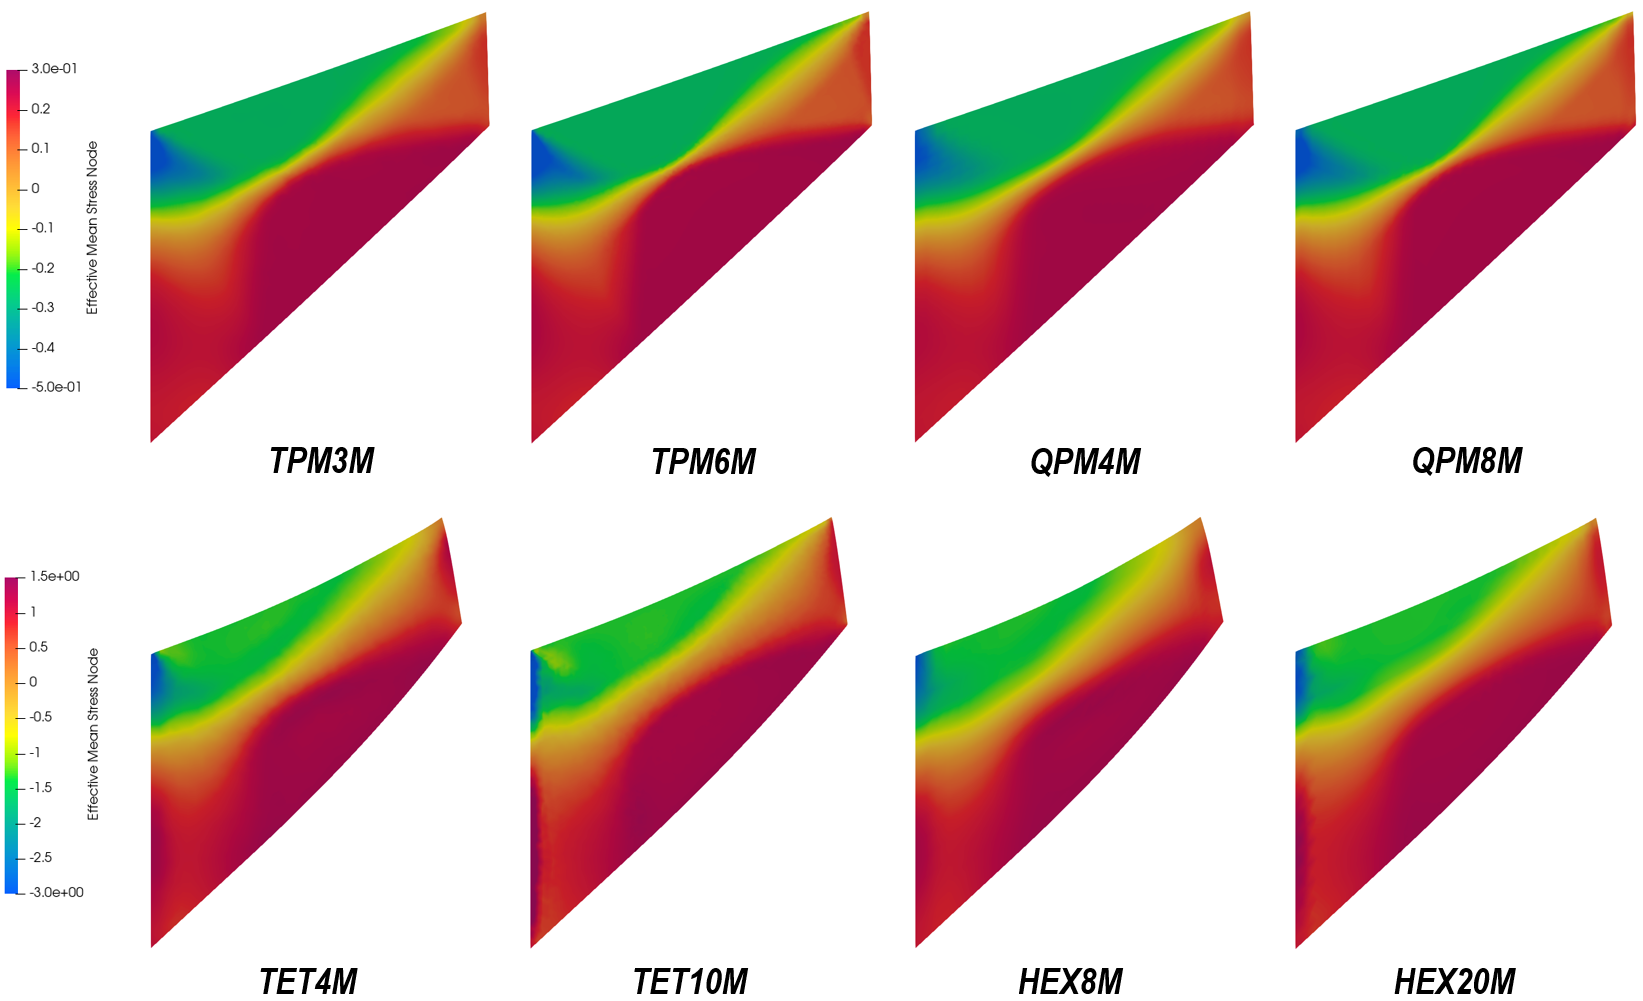
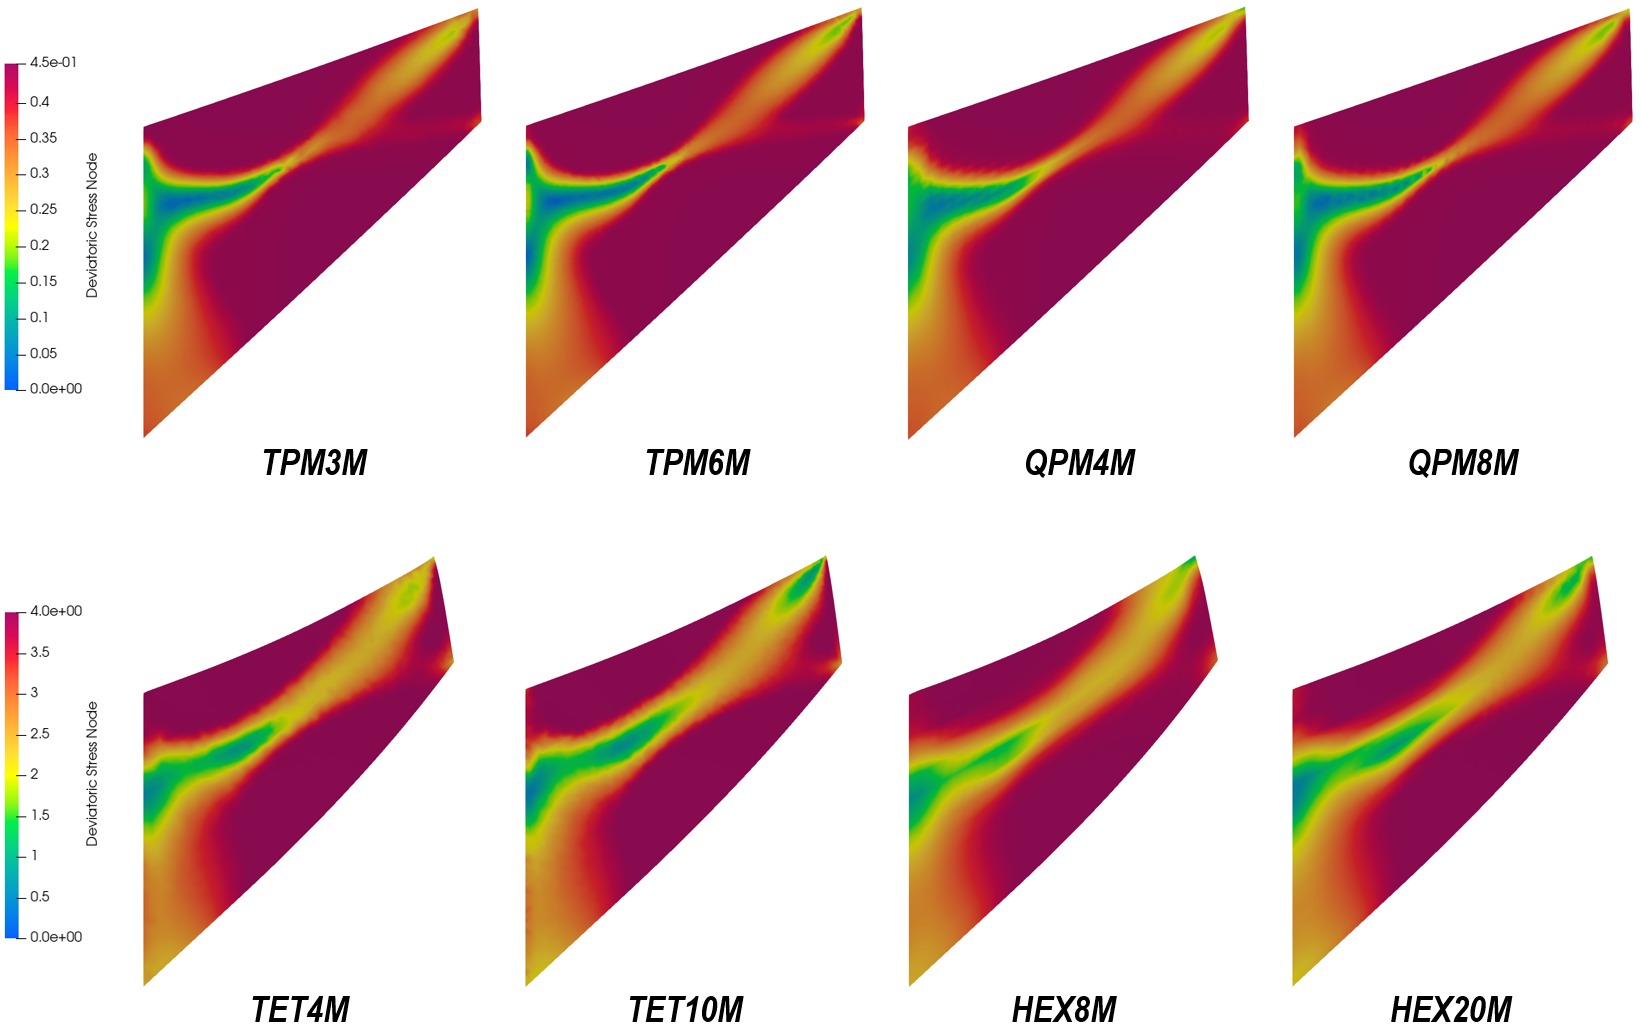
The following figures show the results of Cook’s membrane deformation. Plastic strain and effective mean stress are plotted at the final time step. As shear load increases, plastic strain develops from compression-dominant region as well as extension-dominant region. These two regions can be identified from the plot of effective mean stress distribution. In 2D case, the distance between the plastic front is closer than the 3D counterpart, indicating that the 2D results are closer to plastic collapse.
Plastic strain contour on selected element types
Effective mean stress contour on selected element types
Deviatoric stress contour on selected element types
|
References
[1] Abaqus Benchmark Manual Version 6.11
|

