Val_005c Oil and Gas Expulsion
Problem Description
The user is assumed to have undertaken the examples Val_005a and Val_005b beforehand.
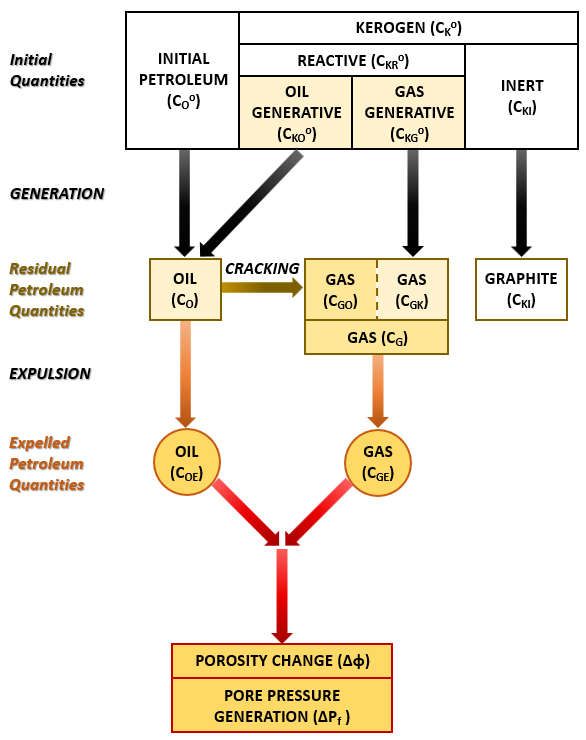
The process of oil and gas expulsion and the consequent porosity change and pore pressure generation (highlighted in Figure 1) are described here. Five thermo-hydro-mechanical (THM) field simulations, one for each of the five pre-defined kerogen organofacies A, B, C, D/E utilising the default kerogen kinetics parameters are performed. The ParaGeo results for expulsion are compared against the results presented in Pepper and Corvi (1995b) - [Figures 20 and 21]. Also presented are the results of porosity change and pore pressure generation resulting from the oil and gas expulsion. Note that a THM coupled simulation is required in order to model the pore pressure generation.
The hydrocarbon kinetics default input parameters for the oil and gas expulsion for the different organofacies A - F are shown in Table 1 below. Note that due to lack of firm experimental evidence, Pepper and Corvi (1995b) assume the global constants for aG and aO as shown in Table 1. Other parameters shown in Table 1 are from calibration of the ParaGeo results to the organofacies "B" results presented in Pepper and Corvi (1995b) - [Figure 20].
|
Data File Description
The data files for the oil and gas expulsion process are in ParaGeo Examples\Validation\Val_005\Val_005c\Data. The model data for each of the organofacies types A - F is similar to Val_005a (default case) with the exception of the hydrocarbon kinetics data and the inclusion of coupled thermo-hydro-mechanical (THM) field data to model the pore pressure generation. Only the key data structures are described here.
Hydrocarbon_kinetics
Group Data
Material Data
Support Data
Control data
|
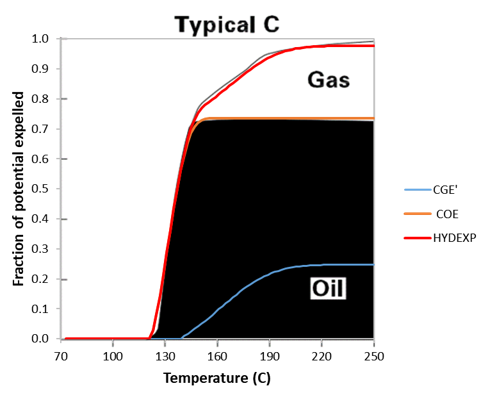
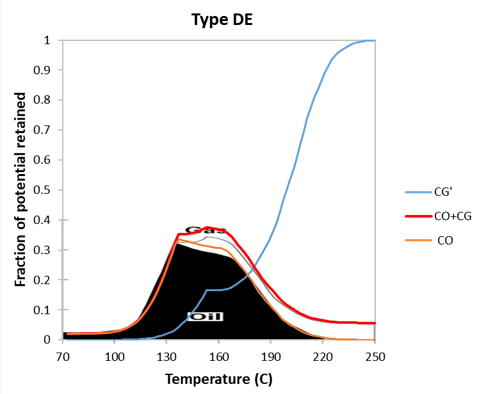
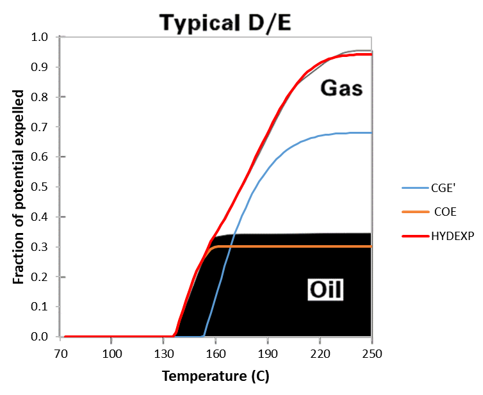
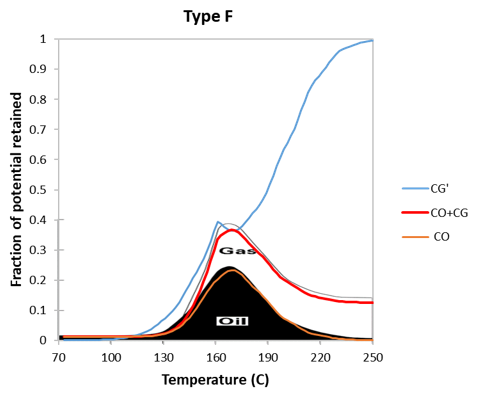
Results for Expulsion of Oil and Gas
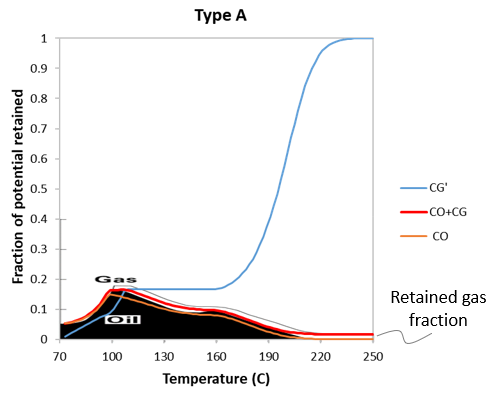
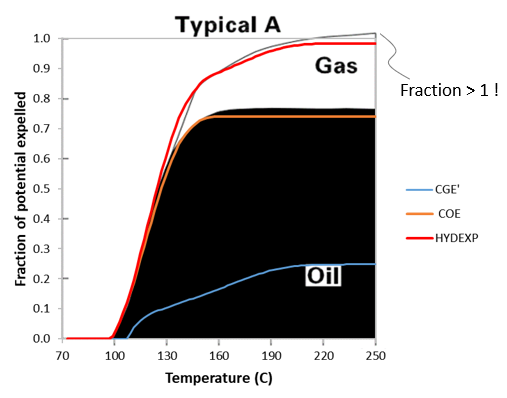
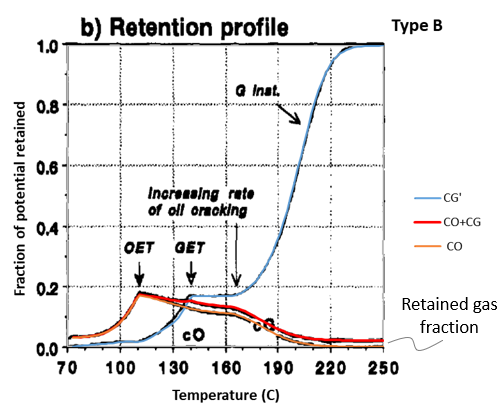
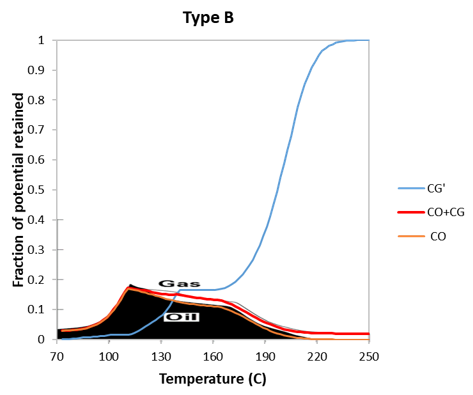
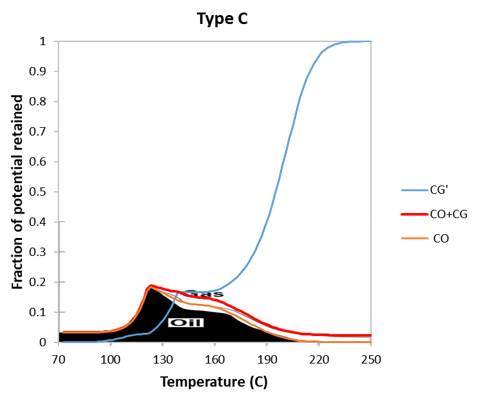
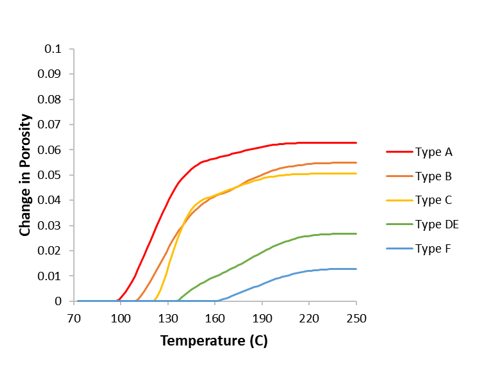
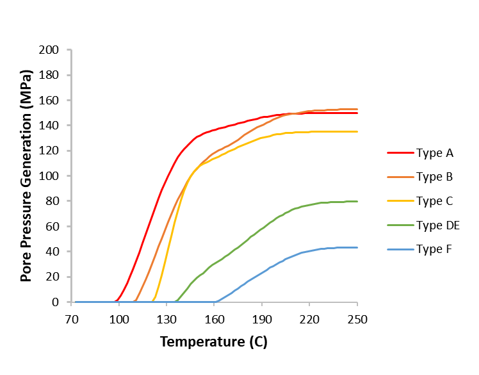
The results files for the oil and gas expulsion for kerogen organofacies types A - F are in ParaGeo Examples\Validation\Val_005\Val_005c\Results. In this directory, the spreadsheet mat_kerogen_expulsion.xlsx contains: •history results output from the simulations. •comparison plots of retention profiles and expulsion profiles against the results presented by Pepper and Corvi (1995b) - [Figures 20 and 21] for organofacies types A - F (see Figure 2, Figure 3, Table 2 and Table 3). •plots of porosity change for organofacies types A - F (Figure 4a). •plots of pore pressure generation for organofacies types A - F (Figure 4b).
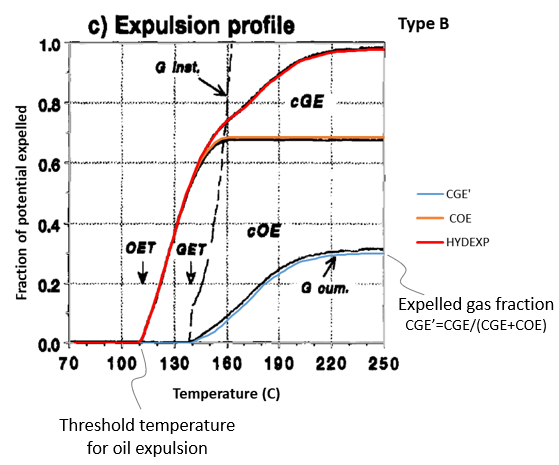
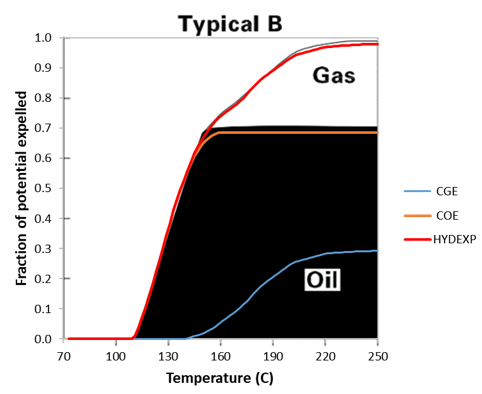
Results for Expulsion of Oil and Gas Comparison of ParaGeo vs Pepper and Corvi (1995b) - Figures 20 and 21] results are presented for: •Retention profiles and Expulsion profiles (Figure 2 and Figure 3). •Expelled gas fractions (Table 2). •Threshold temperature for oil expulsion (Table 3).
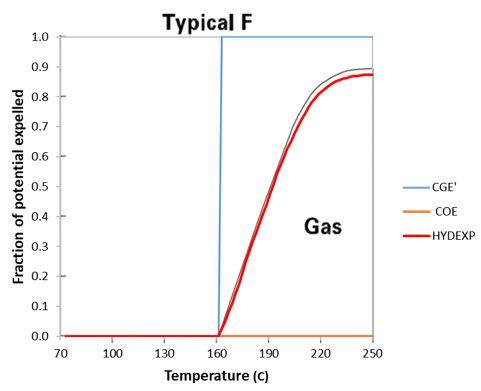
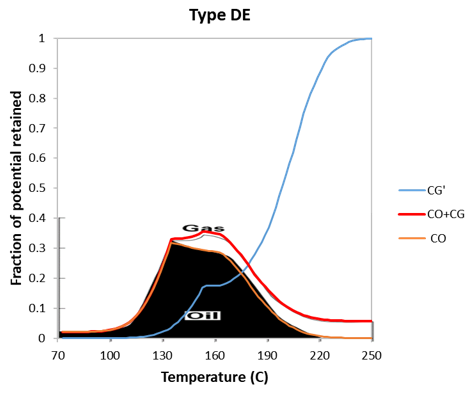
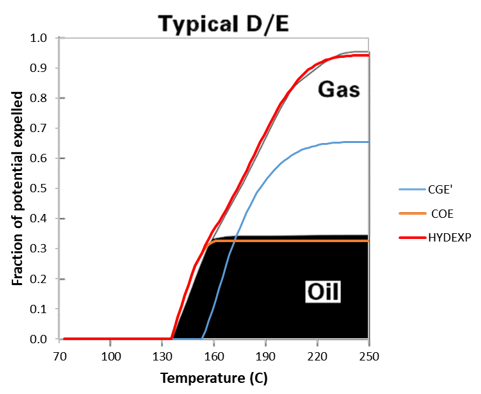
Figure 2 and Figure 3 below shows a comparison of the ParaGeo results (using default parameters listed in Table 1) for retention and expulsion profiles against the results presented by Pepper and Corvi (1995b) - [Figure 20 for 'B' and Figure 21 for 'A-F'] for organofacies types A - F. Note that the reference profiles are of poor quality as highlighted for the A case expulsion profile where the reference fraction is shown to be greater than 1 which is not possible. The poor quality reference profiles are also highlighted for the B case where the ParaGeo results are overlaid onto both sets of reference profiles - the first set against Figure 20 of the reference show excellent correlation in the profiles in contrast to the second set.
Despite the poor quality reference profiles for retention and expulsion, the comparison plots against ParaGeo show similar results. The similarity is ascertained with the comparisons for the expelled gas fractions (Table 2) with a % difference of 0 - 1.5 and threshold temperatures for oil expulsion (Table 3) with a % difference of 0.9 - 2.5.
Calibration for a better fit to the reference solution is performed for organofacies DE with a carbon fraction of oil (Wo) parameter set to 0.80 (from 0.85). The improved results are shown in Figure 3 below.
Table 2 below shows a comparison of the ParaGeo results (with default parameters and one calibration) for expelled gas fractions against the results presented by Pepper and Corvi (1995b) for organofacies types A - F. The fraction of gas expelled is a perfect match to the reference solution for all organofacies apart from the DE case with a 4.6% difference. This correlation to the reference solution was shown to improve to a 1.5% difference with calibration of Wo = 0.8 (from 0.85).
Table 3 below shows a comparison of the ParaGeo results (with default parameters and one calibration) for the threshold temperature for oil expulsion against the results presented by Pepper and Corvi (1995b) for organofacies types A - F. This shows excellent correlation between the two sets of results.
Results for Porosity change and Pore pressure generation
Figure 4 below shows the ParaGeo results for (a) porosity change and (b) pore pressure generation resulting from the oil and gas expulsion for organofacies types A - F. The change in porosity is decreasing from A -> F, this is in line with the increasing amount of inert kerogen from A -> F. The amount of pore pressure generation for organofacies A, B and C is observed to be much greater than those for organofacies D/E and F, however, not following the trend of porosity change exactly. This is due to the different hydrocarbon densities defined for A - F.
Note that the amount of pore pressure generated is artificially high due to the pseudo-artificial conditions of the single element model. A more suitable example to observe overpressure due to hydrocarbon generation would be a uniaxial column with sediment compaction and increasing temperature with burial Kin_001.
|
||||||||||||||||||||||||||||||||||||||||||||||||||||||||||||||||||||||||||||||||||||||||||||||||||||||||||||||||||||||
References
[1] Pepper, A.S. and Corvi, P.J. (1995(a)): Simple kinetic models of petroleum formation. Part I: Oil and gas generation from kerogen. Marine and Petroleum Geology. 12(3) 291–319. 1995(a). [2] Pepper, A.S., Dodd, T.A. (1995): Simple kinetic models of petroleum formation. Part II: Oil-gas cracking. Marine and Petroleum Geology. 12(3) 321-340. [3] Pepper, A.S. and Corvi, P.J. (1995(b)): Simple kinetic models of petroleum formation. Part III: Modelling an open system. Marine and Petroleum Geology. 12(4) 417-452. [4] Sweeney, J.J. & Burnham, A.K. (1990): Evaluation of a simple model of vitrinite reflectance based on chemical kinetics. AAPG Bull. 74 10., 1559 – 1570.
|

