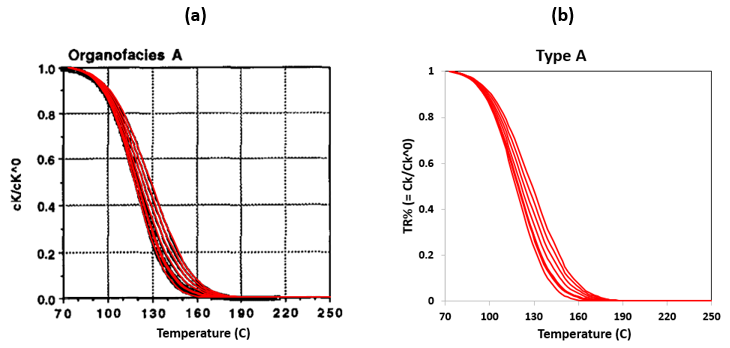
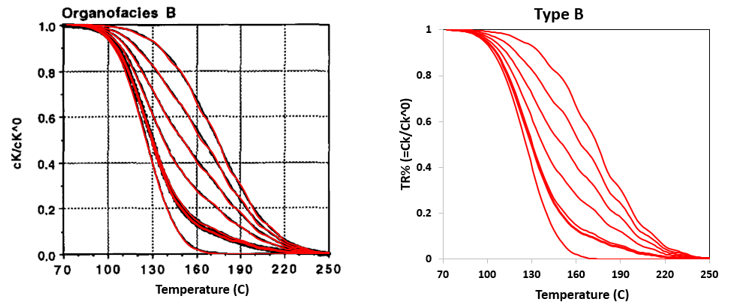
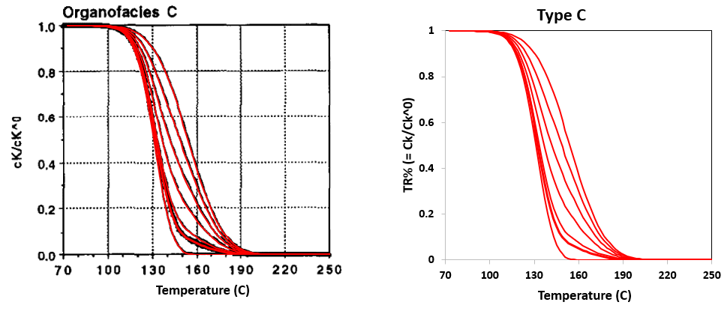
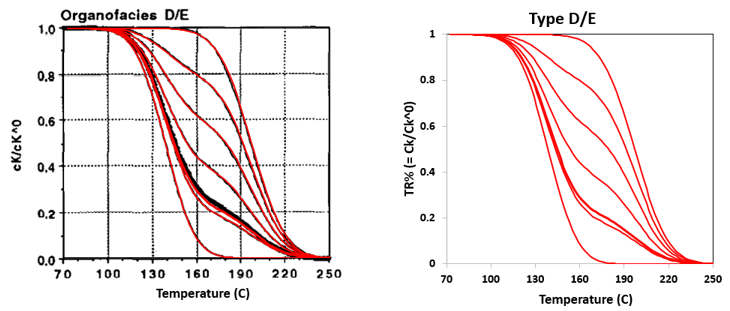
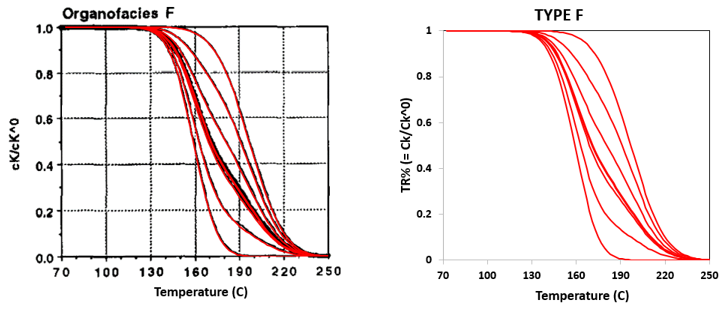
The data files for the kerogen -> oil/gas generation for different gas concentration ratios are in ParaGeo Examples\Validation\Val_005\Val_005a. These are placed in different sub-folders for the different kerogen organofacies types.
The basic data includes:
1Geometry data (Nodal_data, Geometry_line and Geometry_surface) for definitions of the 2D geometry. 2Group_control_data activates the thermal field for the current simulation group. 3Group_data defines the group name, element type number, material number, kerogen property name, porous flow type and the associated surface entity. 4Hydrocarbon_kinetics defines the assignment and processing data associated with hydrocarbon kinetics, e.g. vitrinite maturation model, oil -> gas cracking model, hydrocarbon density model and density. 5Kerogen_kinetics defines the assignment and processing data associated with kerogen kinetics, e.g. kerogen organofacies type, total organic carbon content (TOC), transformation index (TI), hydrocarbon index (HI), gas concentration ratio (G), weight fraction carbon (W), etc. 6Material_data defines the thermal field material properties of the model. 7Fluid_properties defines the fluid properties of the model. 8Support_data constrains the temperatures on the surface entity. 9Global_loads defines the prescribed temperatures on the surface entity with loading rate defined via the Time_curve_data data structure. Load_case_control_data defines the surface load as active. 10History_point outputs element porosity, temperature and pore pressure and state variables for the hydrocarbon kinetics every 1.0 time unit. 11Mesh_control_data and Structured_mesh_data are used to generate a single structured element mesh for the surface entity. 12Thermal_control_data defines the solution algorithm (3 - linear transient) for solving the thermal field, termination time = 90, etc.
Hydrocarbon_kinetics
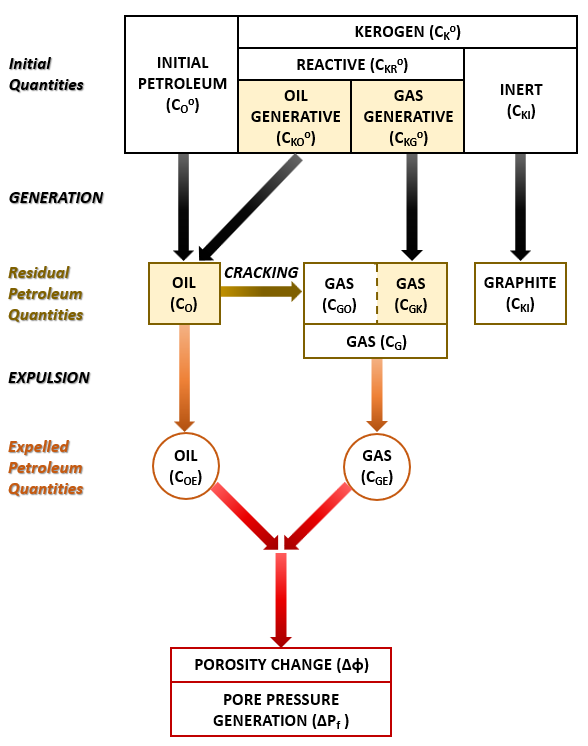
Hydrocarbon_kinetics defines the assignment and processing data associated with hydrocarbon kinetics, e.g. vitrinite maturation, oil -> gas cracking, hydrocarbon expulsion, hydrocarbon density for porosity update and pore pressure generation.
Data File
|
|
* Hydrocarbon_kinetics NUM=0
Maturation_model 'EasyRo'
Oil_gas_cracking_model None
Hydrocarbon_density_model "Constant"
Hydrocarbon_density_properties IDM=1
898
|
1Maturation_model "EasyRo" is defined. 2Oil -> gas cracking model is defined as "None". 3The Hydrocarbon_density_model for the evaluation of the density of the expelled hydrocarbon is defined as "Constant". 4Hydrocarbon_density_properties define the density of the expelled hydrocarbon. This density is a combination of oil and liquid gas and varies for the different organofacies A-F (Table 3).
|
|
Kerogen_kinetics
Kerogen_kinetics defines the assignment and processing data associated with kerogen kinetics property name "kerogen1", e.g. kerogen organofacies type, total organic carbon content (TOC), transformation index (TI), hydrocarbon index (HI), gas concentration ratio (G), weight fraction carbon (W), Universal gas constant and kerogen density. Depending on the organofacies type defined in Kerogen_facies_type, the kerogen kinetics data shown in bold are substituted for the default values listed in Table 2. Only the gas concentration value for G is varied in the study for each kerogen organofacies type.
Notes:
1Kerogen_oil_properties (kerogen->oil) and Kerogen_gas_properties (kerogen->gas) are not explicitly defined in Kerogen_kinetics, however, depending on the organofacies type defined in Kerogen_facies_type, the default ParaGeo parameters for the pre-multiplier A0, activation energy Emean and variance σ as described in Hydrocarbon maturation are applied to the model by default.
Data File
|
|
* Kerogen_kinetics NUM=1
Name "kerogen1"
Kerogen_facies_type "A"
TOC 8.0
Transformation_index 0.033
Hydrocarbon_index 0.617
Gas_concentration 0.17
Weight_fraction_carbon 0.80
Universal_gas_constant 0.00831446261815324
Kerogen_density 1200.0
|
1Kerogen property name is "kerogen1". 2Kerogen_facies_type specifies one of the five pre-defined types of kerogen organofacies (i.e. A, B, C, D/E, F). 3TOC defines the total organic carbon by weight as 8.0 percent, i.e. 8% of the rock matrix mass is kerogen. 4Transformation_index (TI) is defined as 0.033 whereby TI = S1/TOC. 5Hydrocarbon_index (HI) is defined as 0.617 whereby HI =S2/TOC. 6 Gas_concentration (G) defines the initial gas concentration ratio. Valid range is 0.0 <= G <= 1.0. 7Weight_fraction_carbon (W) defines the weight fraction of carbon in hydrocarbons as 0.8. 8The universal gas constant (R) is defined as 0.00831446261815324 kJ/K/mol. 9Kerogen density is defined as 1200 kg/m3.
|
|
Group Data
Group data
•Group_data defines the group name, element type number, material number, kerogen property name, porous flow type and the associated surface entity.
Data File
|
|
* Group_data NUM=1
Group_name "Default-1"
Element_type_number 7
Material_number 1
Kerogen_assignment "kerogen1"
Surfaces IDM=1
1
Porous_flow_type 2
|
1Group name and material number are defined. 2Porous_flow_type 2 corresponding to drained analysis with non-zero pore pressures is defined. 3Element_type_number 7 corresponds to QPM4 for a 4-node 2D plane strain element . 4Kerogen_assignment defines the name of the kerogen property set "kerogen1" assigned to the group. |
Group control data
•Group_control_data activates the thermal field for the current simulation group.
Data File
|
|
* Group_control_data
Group_numbers IDM=1
1
Active_thermal_groups IDM=1
1
|
1Group_control_data activates the thermal field for the current simulation group.
|
|
Material and Fluids Property Data
Material data
•Material_data defines the thermal field material properties of the model.
Data File
|
|
* Material_data NUM=1
Material_name "Sand"
Grain_density 2500
Grain_conductivity_type 1
Grain_conductivity 1
Grain_specific_heat 1E-3
Porosity 0.20
Singlephase_fluid 1
|
1Material name is defined as "Sand". 2Grain density = 2500 kg/m3 is defined. 3Grain conductivity type is defined as isotropic. 4Isotropic grain conductivity is defined as 1 and grain specific heat is defined as 1E-3. These data are required to be defined but are inconsequential in this example as the temperature is fully prescribed. 5Porosity is defined as 0.2. 6Fluid_properties number 1 is assigned to the material. |
Fluids property data
•Fluid_properties defines the fluid properties of the model.
Data File
|
|
* Fluid_properties
Name "Water"
Fluid_type "Water"
Equation_state_type 0
Stiffness 2000.0
Density 1000.0
Viscosity_type 1
Viscosity 2.80E-23
Conductivity 1
Specific_heat 1E-3
|
1Fluid properties for "Water" are defined. 2Water stiffness is set to 2000 MPa. 3Water density of 1000 kg/m3 is defined. 4The gas equation of state type is set to 0, i.e. nearly incompressible liquid. 5Fluid viscosity type is set to 1, i.e. constant viscosity with a value of 2.80E-23 MPa.Ma (c.a. 0.88cP). 6Isotropic fluid conductivity is defined as 1 and fluid specific heat is defined as 1E-3. These data are required to be defined but are inconsequential in this example as the temperature is fully prescribed.
|
|
Loading and Support Data
Loading data
•Global_loads defines the prescribed temperature on the surface entity with loading rate defined via the Time_curve_data data structure. •Load_case_control_data defines the surface load as active.
Data File
|
|
* Global_loads NUM=1
Prescribed_temperature IDM=1 JDM=2
1
0
Pres_temperature_surfaces IDM=1 JDM=2
1
1
* Time_curve_data NUM=1
Time_curve IDM=2
0 90
Load_factor IDM=2
70 250
* Load_case_control_data NUM=0
Loadcases IDM=1
1
Active_load_flags IDM=1
2
|
1A prescribed temperature of unit load is defined for the surface entity. 2This load is linearly ramped up from a load factor of 70 to 250 over a time duration of 90 Ma. 3The load is defined as being active in Load_case_control_data (flag 2).
|
Support data
•Support_data constrains the temperature on the surface entity.
Data File
|
|
* Support_data NUM=1
Temperature_codes IDM=1 JDM=1
1
Temperature_code_surfaces IDM=1 JDM=2
1
1
|
1Temperature constraint is defined for the surface entity.
|
|
Mesh Data
Mesh_control_data and Structured_mesh_data are used to generate a single structured element mesh for the surface entity.
Data File
|
|
* Mesh_control_data
Generation_algorithm 1
Mesh_generation_flag 0
* Structured_mesh_data
Default_divisions 1
Surfaces IDM=1
1
|
1Generation algorithm is set to 1, i.e. structured mesh. 2Mesh generation flag is set to 0 so that analysis will be performed after mesh generation. 3Default number of divisions is set to 1 for the surface entity number 1, i.e. a single element model.
|
|
History_point
History_point outputs element porosity, temperature and pore pressure and state variables for the hydrocarbon kinetics every time unit.
Data File
|
|
* History_point NUM=1
Name "Set1"
Group 1
Output_frequency_time 1
Point_coordinates IDM=2 JDM=1
0.1 0.5
Element_data IDM=3
"Porosity" "Elt_temp" "Elt_pore"
Hc_kinetics_state_variables IDM=14
K_CKO K_CKG K_CO K_CG K_CGO K_COE K_CGE K_CKI K_PI K_HI
K_TR K_VR K_KTR K_COTOT
|
1A history point named "Set 1" is defined just inside point 1 at X=0.1m, Y=0.5m to output data every 1.0 Ma. 2These history data include element porosity, temperature and pore pressure. 3Also output are state variables for the hydrocarbon kinetics: a.K_CKO - Kinetic concentration of kerogen converted to oil b.K_CKG - Kinetic concentration of kerogen converted to gas c.K_CO - Kinetic concentration of oil d.K_CG - Kinetic concentration of gas e.K_CGO - Kinetic concentration of oil converted to gas f.K_COE - Kinetic concentration of oil expelled g.K_CGE - Kinetic concentration of gas expelled h.K_CKI - Kinetic concentration of inert kerogen i.K_PI - Kinetic production index j.K_HI - Kinetic hydrocarbon index k.K_TR - Kinetic transformation ratio l.K_VR - Kinetic vitrinite reflectance m.K_KTR - Kinetic kerogen transformation ratio n.K_COTOT - Kinetic total oil (CO + generated)
|
|
Thermal_control_data
Thermal_control_data defines the solution algorithm (3 - linear transient) for solving the thermal field, termination time = 90, etc.
Data File
|
|
* Thermal_control_data
Control_title "stage"
Solution_algorithm 3
Initial_time_step 0.5
Maximum_time_step_growth 100
Minimum_time_step 0.1
Maximum_time_step 0.5
Maximum_number_time_steps 1000000
Termination_time 90
Output_frequency_plotfile -1
Output_frequency_restart 0
Screen_message_frequency 10
Output_time_plotfile 10
Output_time_restart 0
Screen_message_time 0
1
|
1Solution algorithm is set to 3, i.e. linear transient. 2Time step size is set to 0.5 Ma. 3A plot file is output every 10 Ma. 4Termination time is set to 90 Ma.
|
|
|

