Simulation example
Two simulation examples are provided to demonstrate that the obtained geometry meshed with TETs contains all the information required to be used in typical ParaGeo analyses. Note that the set up of the data files will not be discussed in detail and only general information is provided here. The data files for the simulation examples are provided in ParaGeo Examples\General Examples\Ex_009\04_Simulation_Examples\Data. The two simulations consist on:
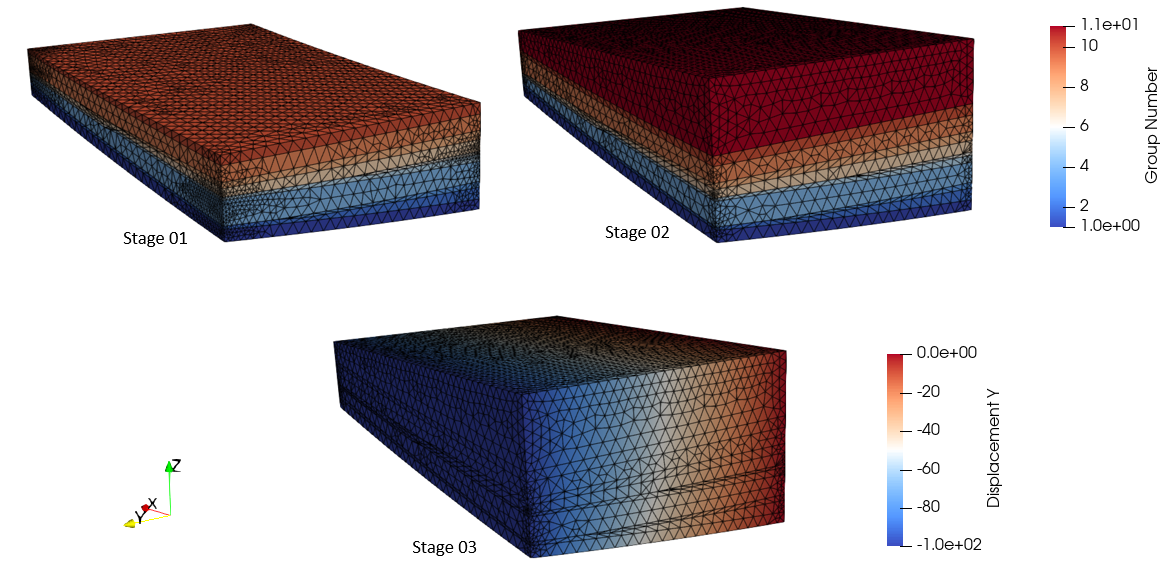
1.Ex_009_Sim01 example considering 3 consecutive stages consisting on gravity initialisation, sedimentation of an additional formation and tectonic compression applied on the West boundary along the Y direction. For simplicity the example considers elastic material.
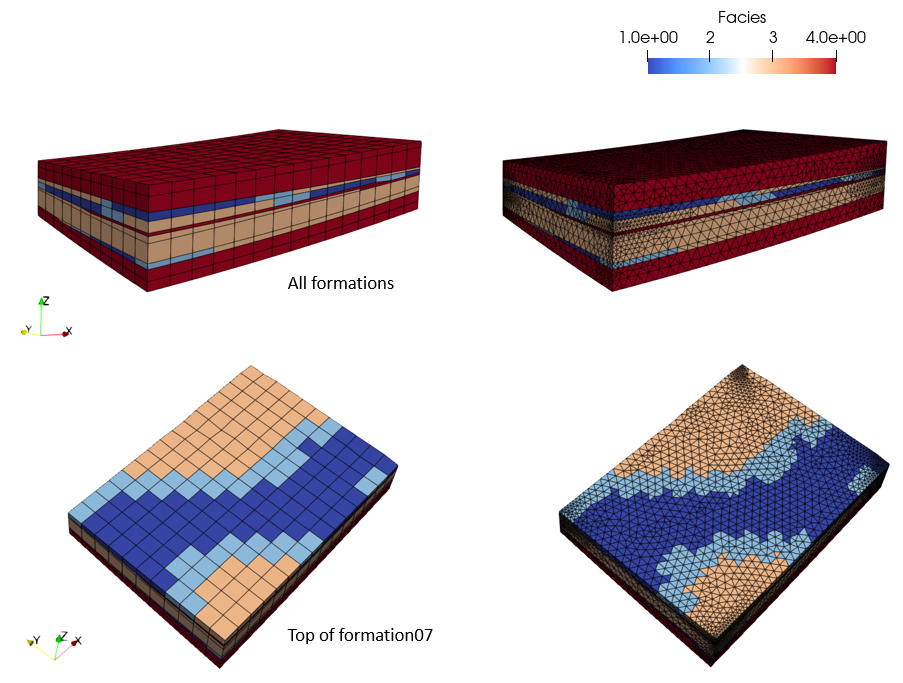
2.Ex_009_Sim02 example that runs 2 time steps to show the mapping of facies from the HEX grid to the TET mesh.
Note that the data files contain the geometry data generated during HEX to TET conversion plus any other data required to run the corresponding examples such as:
1.Stratigraphy_definition and Stratigraphy_horizon data required to perform sedimentation
2.Material_data and Fluid_properties
6.Adaptivity_control_data and Adaptivity_set_data with the minimal data required for sedimentation (Sim01 only)
7.Sedimentation_horizon and part geometry data defining the topology of the sediment horizon (Sim01 only)
8.Sedimentation_data for the new deposited unit (Sim01 only)
9.Loading data (Global_loads, Load_case_control_data and the associated Time_curve_data) defining the tectonic displacement applied to the West boundary (Sim01 only)
10.Facies_definition and Spatial_state_set for assignment of the facies to the TET mesh (Sim02 only)
11.Control_data for each stage
| Results |
The results are provided in ParaGeo Examples\General Examples\Ex_009\04_Simulation_Examples\Results
View of the results at the end of each stage for Ex_009_Sim01
Comparison of facies distribution in the initial HEX grid and the TET mesh. The bottom plot has only formations 01 to 07 visible.
|


