In this example a 3D cased and cemented wellbore model will be modelled. The focus of this example will be the influence of cement hardening on the stresses and strains in the cement and formation. The model geometry considers a quarter symmetry (normal displacements constrained on the symmetry boundaries). The dimensions are indicated in the figure below. The various components are discretized into tetrahedral elements with finer mesh at the wellbore and contact interfaces.
Units of the model for stress, length, time and temperature are Pa, m, hours and Celsius respectively. The simulation run completes in <2 minutes on a 3.6 GHz AMD processor machine.
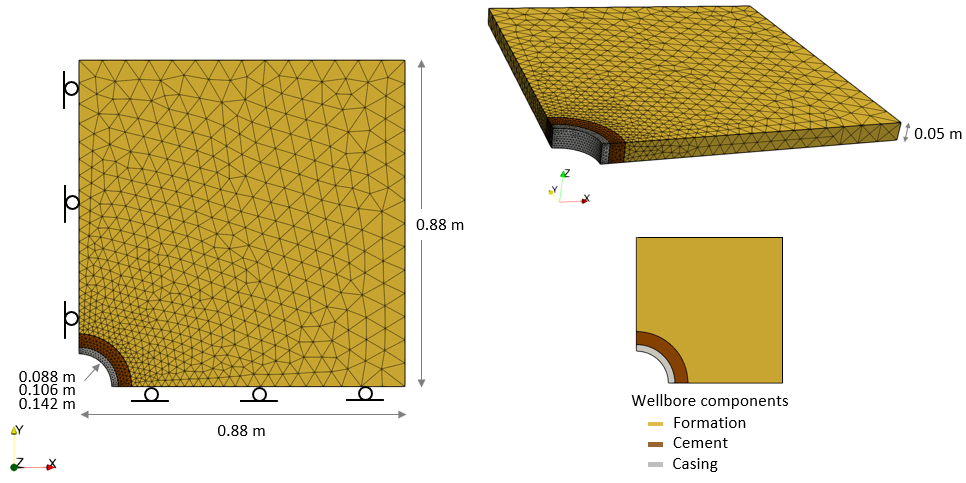
View of the wellbore model geometry (quarter-symmetry)
The simulation comprises five stages with the timings summarized in the table below :
Stage #
|
Description
|
Duration (hours)
|
Time lapse (hours)
|
Stage 1
|
Pre-drill initialization
|
1
|
0 - 1
|
Stage 2
|
Drilling + Casing/Cement installation
|
10
|
1 - 11
|
Stage 3
|
Cement hardening
|
40
|
11 - 51
|
Stage 4
|
Start of injection (ramp up)
|
0.01
|
51 - 51.01
|
Stage 5
|
Constant injection
|
1.0
|
51.01 - 52.01
|
Stage 1: Pre-drill initialization in a single step
1.Apply initial geostatic condition (stresses, pore pressure and temperature) to the various wellbore components:
i.Formation: Effective stresses of σx' = -2.3·106 Pa, σy' = -3.4·106 Pa, σz' = -6.3·106 Pa, an initial pore pressure of Pp = 21·106 Pa and an initial temperature of To = 132°C.
ii.Cement (slurry): Total stresses of σx = -23.3·106 Pa, σy = -24.4·106 Pa, σz = -27.3·106 Pa (i.e. Pp = 0 Pa) and an initial temperature of To = 132°C. Note that due to plasticity in the very weak cement material defined with very low yield strength in this stage, the cement stresses become hydrostatic at -25·106 Pa. Note that porous flow for the cement is de-activated.
iii.Casing: Total stresses of σx = -23.3·106 Pa, σy = -24.4·106 Pa, σz = -27.3·106 Pa (i.e. Pp = 0 Pa) and an initial temperature of To = 132°C. Note that porous flow for the casing is de-activated.
Note that the total stress (effective stress + pore pressure) values are the same for all the above wellbore components.
2.Apply appropriate constraints:
i.Pore pressure - Apply a pore pressure constraint to the outer/'far-field' boundary surfaces of the formation.
ii.Temperature - Apply a temperature constraint to all volumes of the three wellbore components (casing, cement, formation).
iii.Mechanical - Apply constraints to all external boundaries:
▪Symmetry and far-field boundaries : Fix the displacements in the perpendicular direction for outer/'far-field' boundary and all symmetry surfaces.
▪Base and top: Fix vertical displacements for the base and top surfaces for all three wellbore components. Note that the top geometry surfaces are defined as separate geometry sets as these will be treated differently in a later simulation stage.
▪Inner casing and contact interfaces: Fix the X and Y displacements on the inner casing wall and the casing/cement and cement/formation contact interface (hanging wall and footwall) surfaces.
At the end of this stage, initial conditions (stress, pore pressure and temperature) for all wellbore components are established. In addition, prerequisite data for constrain release (which takes place in the next stage) of the well surfaces and top of the cement has been defined.
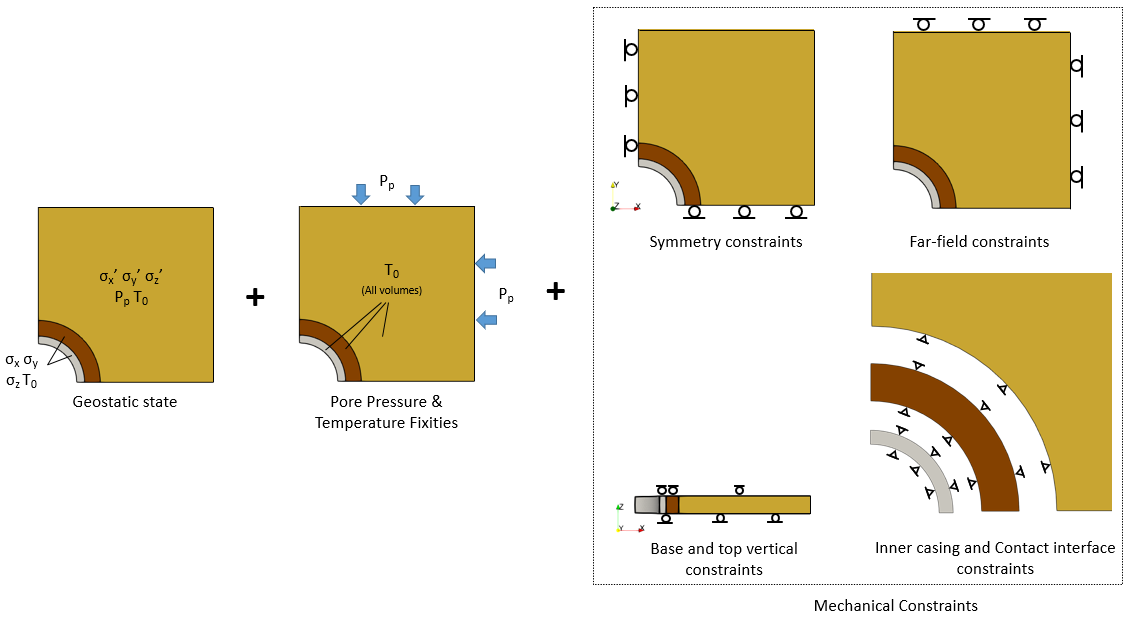
Schematic of initial geostatic condition and and constraints during pre-drill initialization phase
Stage 2: Drilling + Casing/Cement installation
1.Constraint release: The constraints on the top of the cement, casing inner wall and at the casing/cement and cement/formation contact surfaces are removed and equivalent stresses slowly ramped down to zero over the stage duration using the Constraint_relaxation data structure.
i.Casing and cement slurry: Mud stress σm of 23·106 Pa (i.e. 2·106 Pa above Pp) is applied to the inner casing surface and top of the cement slurry. This stress is slowly ramped up as the constraints are relaxed down to zero.
2.Vertical constraints (cement slurry): To allow the stresses in the cement to remain hydrostatic during the relaxation process, movement in the cement is allowed but with the displacements at the top of the cement coupled in Z.
At the end of this stage, contact stresses at the casing/cement and cement/formation are established and the cement slurry stress remain hydrostatic.
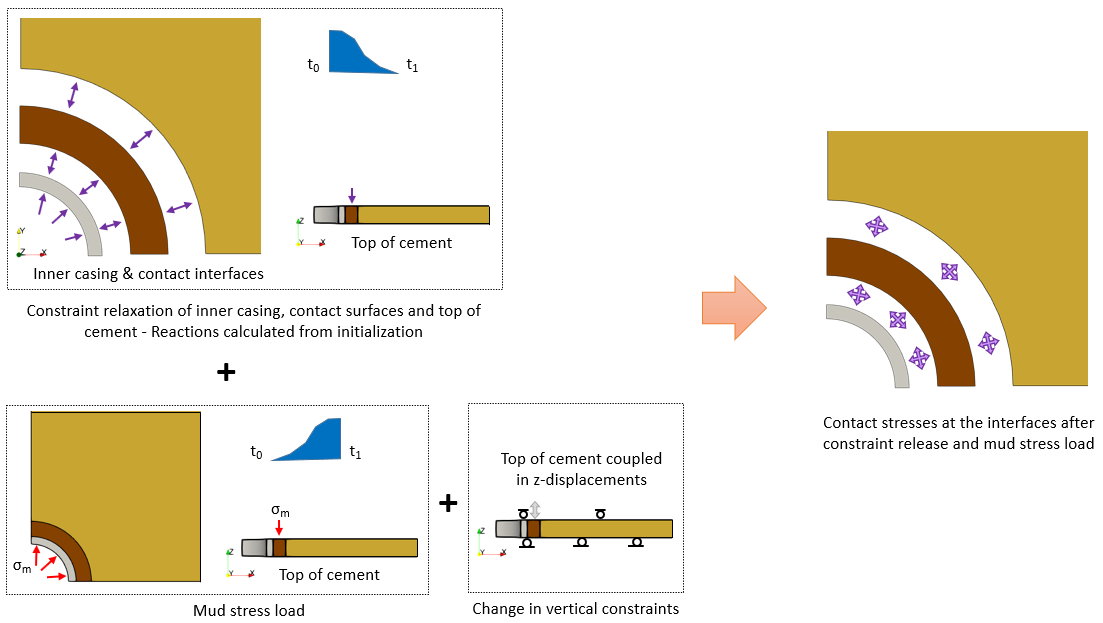
Schematic of boundary conditions during drilling + casing/cement installation phase
Stage 3: Cement hardening
1.Cement material von Mises yield strength is increased from 0.02·106 Pa to 50·106 Pa over the stage duration to represent the cement in its fluid state (slurry) and hardened/cured state.
2.Associated cement shrinkage is represented via a diagenetic reaction porosity power law model which is temperature independent.
3.Top of cement is fixed in Z-displacements. This vertical constraint replaces the mud stress and coupled Z-displacements in the previous stage.
At the end of this stage, the cement is deemed to have cured and hardened with resulting volumetric shrinkage.

Schematic of cement hardening phase
Stage 4: Start of injection
Injection loading on the inner casing surface is represented with a temperature reduction from 132°C to 72°C. This load is slowly ramped down via an s-curve ramp over the stage duration.
Stage 5: Constant injection
A constant injection temperature of 72°C is applied on the inner casing surface throughout the stage.
Material Properties
The materials are defined in a separate file named Wellbore_001_Case01.mat which is included in the main datafile using the command Include. The properties for the different wellbore components are defined as:
•Sandstone (Formation) - elastic
•Casing - elastic
•Cement (slurry -> hardened) - von Mises plasticity model with time-dependent hardening and diagenesis data (see later for more detailed description)
The properties are summarized in the tables below:
Parameter
|
Sandstone (Formation)
|
Casing
|
Cement (Slurry -> Hardened)
|
Grain Stiffness, Kg
|
50 GPa
|
50 GPa
|
50 GPa
|
Grain density, ρg
|
2700 Kg/m3
|
2700 kg/m3
|
2700 kg/m3
|
Porosity
|
0.3
|
0.03
|
0.03
|
Young's Modulus, E
|
10 GPa
|
206.8 GPa
|
22.1707 GPa
|
Poisson's Ratio, υ
|
0.25
|
0.3
|
0.185
|
Plastic material type
|
-
|
-
|
7 (von Mises)
|
Yield stress, σy
|
-
|
-
|
0.02 MPa -> 50 MPa
|
The additional material parameters related to the porous flow and thermal fields are:
Parameter
|
Sandstone
|
Casing
|
Cement (Slurry)
|
Permeability type
|
1 (Constant isotropic)
|
1 (Constant isotropic)
|
1 (Constant isotropic)
|
Permeability (k)
|
1·10-12 m2
|
1·10-22 m2
|
1·10-22 m2
|
Biot constant (α)
|
1.0
|
1.0
|
1.0
|
Fluid saturation (Sf)
|
1.0
|
1.0
|
1.0
|
Single phase fluid
|
1 (Water)
|
1 (Water)
|
1 (Water)
|
Grain conductivity type
|
1 (Isotropic)
|
1 (Isotropic)
|
1 (Isotropic)
|
Grain thermal conductivity
|
1.80E+04 (N.m/hr)/m/K (i.e. 5 *W/m/K)
|
1.80E+05 (N.m/hr)/m/K (i.e. 50 *W/m/K)
|
9.0E+04 (N.m/hr)/m/K (i.e. 25 *W/m/K)
|
Grain specific heat capacity
|
810 J/kg/K
|
500 J/kg/K
|
1000 J/kg/K
|
Linear thermal expansion coefficient
|
6·10-6 K-1
|
13·10-6 K-1
|
5·10-6 K-1
|
Grain thermal expansion coefficient
|
18·10-6 K-1
|
39·10-6 K-1
|
15·10-6 K-1
|
Fluid Properties
The principal parameters, including thermal, for the pore "water" are:
Parameter
|
Water
|
Stiffness, Kw
|
2 GPa
|
Density, ρw
|
1040 kg/m3
|
Viscosity, μw
|
1·10-3 Pa· s (1cP)
|
Fluid thermal conductivity
|
2196 (N.m/hr)/m/K (i.e. 0.61 *W/m/K)
|
Fluid specific heat capacity
|
4000 J/kg/K
|
Fluid thermal expansion coefficient
|
69·10-6 K-1
|
*W/m/K or (N.m/s)/m/K
Note that in order to model shrinkage/expansion due to temperature, the thermal expansion coefficient data must be defined for the solid material and fluid data.
The data files for the examples are in directory: ParaGeo_Tutorial_Examples\Wellbore_001\Case01\Data.
Cement material data with time-dependent hardening and diagenetic shrinkage data
Data File
|
|
* Material_data
Name "Cement"
Isotropic_Elastic_properties IDM=2
/Young's Modulus/ 2.21707E+10
/Poisson's Ratio/ 0.185
Plastic_material_type 7
Plastic_properties IDM=1
/Yield Strength/ 20.0E+03
Hardening_type 7
Hardening_variable2_name "Time"
Hardening2_update_frequency 1
Hardening_variable2_values IDM=3
0.0 11.0 51.0
Hardening_properties2 IDM=2 JDM=2 KDM=3
0 1.0
20.0E+03 20.0E+03
0 1.0
20.0E+03 20.0E+03
0 1.0
50.0E+06 50.0E+06
Porosity 0.03
Grain_density 2700
Grain_stiffness 50000E+6
Biot_properties IDM=1
1.0
Permeability_type 1
Permeability 1E-22
Fluid_saturation 1.0
Singlephase_fluid 1
Grain_conductivity_type 1
Grain_conductivity 9.0E+04
Grain_specific_heat 1000
Linear_therm_exp_coeff 5.0E-06
Grain_therm_exp_coeff 1.5E-05
Diagenesis_reaction_names IDM=1
"Shrinkage"
* Diagenesis_data
Name "Shrinkage"
Reaction_model_name "Porosity"
Reaction_properties IDM=3
0.00115
0.4
11.0
Maximum_porosity_change 0.0107
Compaction_direction_factor 1.0
Tension_stress_flag 1
|
1For the purpose of demonstrating the workflow, the cement material in this example has been represented with a simple von Mises plasticity material model. Users are advised to represent the cement material with material models they deem suitable for their simulations. Of importance in this workflow is the definition of the time-dependent hardening data and the diagenetic shrinkage data.
2The time-dependent hardening data over the duration of the cement hardening stage comprise of: a.Hardening_type is set to 7 for von Mises hardening. b.Hardening_variable2_name is defined as "Time" for time dependency variation. c.Hardening2_update_frequency is set to 1 for coupled examples to update every flow/thermal time increment. d.Hardening_variable2_values define the number of time variables and their values. Three values are defined in this example, i.e. initial time 0, start time = 11.0 and end time = 51.0 for the cement hardening stage. e.Hardening_properties2 define the hardening properties for the three time variables. In this example, the yield strength of the cement is increased from 20E3 Pa at time 11.0 to 50E6 Pa at time 51.0. The yield strength in between these two time variables are linearly interpolated during the simulation in accordance with the update frequency defined. Note that there must be a minimum of two values defined in the property table, hence, in this example, two effective plastic strains are defined with the same yield strength values.
3The associated shrinkage with cement hardening is modelled using a diagenetic reaction based on porosity change using a simple power law that is temperature independent: a.Diagenesis_reaction_names define the name of the diagenetic reaction assigned to the cement material data, in this example, the name is defined as "Shrinkage".
4Diagenesis_data data structure with Name of "Shrinkage" defines the properties for the diagenetic reaction of the cement material: a.Reaction_model_name defines the type of diagenesis reaction as "Porosity" which uses a simple power law based on the following equation that is temperature independent: 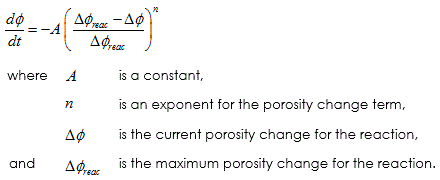
b.Reaction_properties defines the properties associated with the "Porosity" diagenetic reaction model, i.e. pre-factor constant Af set to 0.0015, exponent n set to 0.4 and initiation time set as 11.0. Maximum_porosity_change has been set as 0.0107. These parameters and their values have been calibrated to give c.a. 1% volume shrinkage. c.Compaction_direction_factor set to 1.0 defines the volume shrinkage to be hydrostatic. d.Tension_stress_flag set to 1 (default for "Porosity" reaction model) defines that the reaction occurs independent of the stress stage. |
|
Group control data
Data File
|
|
* Group_control_data
Group_numbers IDM=3
1 2 3
Active_geomechanical_groups IDM=3
1 1 1
Active_porous_flow_groups IDM=3
0 0 1
Active_thermal_groups IDM=3
1 1 1
|
1Group numbers 1 to 3 correspond to casing, cement and formation respectively. 2The porous flow groups for casing and cement are set to 0 (de-activated).
|
Geometry set data
Data File
|
|
.....
* Geometry_set NUM=10
Name "Top_casing"
Surfaces IDM=1
14
* Geometry_set NUM=11
Name "Top_cement"
Surfaces IDM=1
15
* Geometry_set NUM=12
Name "Top_formation"
Surfaces IDM=1
16
.....
|
1The Geometry_set data for the top surfaces of the casing, cement and formation are defined individually as the top of the cement will be treated differently (i.e. have different assignments) to the casing and formation.
|
|
Contact global data
Data File
|
|
* Contact_global
Included_contact_sets IDM=1
"All"
All_geometry_flag 0
Algorithm 2
Contact_flow_flag 0
Contact_thermal_flag 1
|
1The contact algorithm is defined as 2 for node-node contact. This algorithm is more suitable for curved contact surfaces associated with wellbore-type examples. Note that the default is 1 for node-facet contact. 2For contact thermal field to be considered, Contact_thermal_flag must be defined as 1. However, Contact_flow_flag is set to 0 since casing and cement porous flow are de-activated and represented as total stress with zero pore pressure.
|
Contact set data
Data File
|
|
* Contact_set NUM=1
Name "All"
Contact_surfaces IDM=4
"Cnt_cascem_ftw"
"Cnt_cascem_hgw"
"Cnt_cemfm_ftw"
"Cnt_cemfm_hgw"
Global_update_frequency 1
Property_name "Cas_cem"
Buffer_factor 0.05
Print_search 1
|
1Set the Buffer_factor to 0.05 which is the recommended value for node-node contact in 2D and 3D. Note that the buffer factor required for node-node contact is much less than for node-facet contact which is 1.0 for 3D. 2Global_update_frequency is set to 1 for coupled problems, i.e. every flow/thermal time increment.
|
Contact property data
Data File
|
|
* Contact_property NUM=1
Name "Cas_cem"
Compression_model 1
Compression_properties IDM=1
10000.0E6
Tangential_model 2
Tangential_properties IDM=2
10000.0E6
0.3
Thermal_model_normal 1
Thermal_properties_normal IDM=2
1.80E+05
1.80E+05
Contact_width 0.001
* Contact_property NUM=1
Name "Cem_fm"
Compression_model 1
Compression_properties IDM=1
10000.0E6
Tangential_model 2
Tangential_properties IDM=2
10000.0E6
0.5
Thermal_model_normal 1
Thermal_properties_normal IDM=2
9.0E+04
9.0E+04
Contact_width 0.001
|
1For the casing/cement "Cas_cem" contact properties: a.The friction coefficient is defined as 0.3. b.The thermal conductivity values are set same as the casing thermal conductivity of 1.80E+05 (N.m/hr)/m/K. Note that this is the scaled value when a time unit of "hours" is used and is equal to 50 (N.m/s)/m/K or 50 W/m/K. c.The contact width is defined as 0.001m.
2For the casing/cement "Cem_fm" contact properties: a.The friction coefficient is defined as 0.3. b.The thermal conductivity values are set same as the cement thermal conductivity of 9.0E+04 (N.m/hr)/m/K which is equal to 25 (N.m/s)/m/K or 25 W/m/K. c.The contact width is defined as 0.001m.
Notes:
1Notice that contact flow property data (normal and tangential) have not been defined for both casing and cement contacts as contact flow is not valid since porous flow in the casing and cement have been de-activated and they are represented using total stress with zero pore pressure. If this were not the case, then the following example contact flow data would need to be included in the Contact_property data.
|
|
Geostatic_data
Data File
|
|
* Geostatic_data NUM=1
Name "Formation"
Groups IDM=1
"Formation"
Initial_stress IDM=3
-2.3E+06 -3.4E+06 -6.3E+06
Pore_pressure_distribution "Constant"
Pore_pressure 2.1E+07
Temperature 132
* Geostatic_data NUM=2
Name "Cement3D"
Groups IDM=1
"Cement3D"
Initial_stress IDM=3
-2.33E+07 -2.44E+07 -2.73E+07
Pore_pressure_distribution "Constant"
Pore_pressure 0.0
Temperature 132
* Geostatic_data NUM=3
Name "Casing3D"
Groups IDM=1
"Casing3D"
Initial_stress IDM=3
-2.33E+07 -2.44E+07 -2.73E+07
Pore_pressure_distribution "Constant"
Pore_pressure 0.0
Temperature 132
|
1In first stage Geostatic_data is specified. This data is used to define the initial stress state, pore pressure and temperature for groups "Formation", "Cement3D" and "Casing3D".
Parameter
|
Formation
|
Cement
|
Casing
|
Temperature
|
132°C
|
132°C
|
132°C
|
Pore pressure
|
21·106 Pa
|
0
|
0
|
Effective stress σx'
|
2.3·106 Pa
|
-
|
-
|
Total stress σx
|
23.3·106 Pa
|
23.3·106 Pa
|
23.3·106 Pa
|
Effective stress σy'
|
3.4·106 Pa
|
-
|
-
|
Total stress σy
|
24.4·106 Pa
|
24.4·106 Pa
|
24.4·106 Pa
|
Effective stress σz'
|
6.3·106 Pa
|
-
|
-
|
Total stress σz
|
27.3·106 Pa
|
27.3·106 Pa
|
27.3·106 Pa
|
|
|
|
|
|
Support_data
Data File
|
|
* Support_data
Displacement_codes IDM=3 JDM=4
1 0 0
0 1 0
0 0 1
1 1 0
Displacement_code_geom_set IDM=13
"Symm-x"
"Symm-y"
"Far-x"
"Far-y"
"Base"
"Top_casing"
"Top_cement"
"Top_formation"
"Casing_in"
"Cnt_cascem_ftw"
"Cnt_cascem_hgw"
"Cnt_cemfm_hgw"
"Cnt_cemfm_ftw"
Displacement_code_geom_ass IDM=13
1 2 1 2 3 3 3 3 4 4 4 4 4
Pore_pressure_codes IDM=1 JDM=1
1
Pore_pressure_code_geom_set IDM=2
"Far-x"
"Far-y"
Pore_pressure_code_geom_ass IDM=2
1 1
Temperature_codes IDM=1 JDM=1
1
Temperature_code_geom_set IDM=1
"All_volumes"
Temperature_code_geom_ass IDM=1
1
|
1Pore pressure constraint is prescribed on the outer/'far-field' boundary surfaces of the formation.
2Temperature constraint is applied to all wellbore volumes (i.e. casing, cement, formation).
3Mechanical constraints are applied to all external boundaries: a.Symmetry and far-field boundaries - Fix the displacements in the perpendicular direction for outer/'far-field' formation boundaries and all symmetry surfaces. b.Base and top: Fix the vertical displacements for the base and top surfaces for all three wellbore components. Note that the top geometry surfaces are defined as separate geometry sets as these will be treated differently in a later simulation stage. c.Inner casing and contact interfaces: Fix the X and Y displacements on the inner casing wall and the casing/cement and cement/formation contact interface (hanging wall and footwall) surfaces.
|
Key history data
•Several history data have been defined for monitoring the results, however, only the key ones are presented here, namely, the variables on the x-axis (i.e. radial direction) for three points in each wellbore component and the average contact variables at the cement interfaces with casing and formation.
Data File
|
|
* History_point NUM=2
Name "Xaxis"
Output_frequency_increment 1
Point_labels IDM=9
"Cas_inner"
"Cas_mid"
"Cas_cnt_cascem"
"Cem_cnt_cascem"
"Cem_mid"
"Cem_cnt_cemfm"
"Form_cnt_cemfm"
"Form_mid"
"Form_bound"
Point_coordinates IDM=3 JDM=9
0.0884 0 -0.025
0.097 0 -0.025
0.1056 0 -0.025
0.1064 0 -0.025
0.124 0 -0.025
0.1416 0 -0.025
0.1424 0 -0.025
0.511 0 -0.025
0.8796 0 -0.025
Displacements IDM=3
"Disp_x" "Disp_y" "Disp_z"
Velocities IDM=3
"Veloc_x" "Veloc_y" "Veloc_z"
Stresses IDM=3
"Strs_xx" "Strs_yy" "Strs_zz"
Strains IDM=3
"Strn_xx" "Strn_yy" "Strn_zz"
Stress_invariants IDM=5
"Effmean" "Vonmises" "Strs_p1" "Strs_p2" "Strs_p3"
Strain_invariants IDM=5
"Vol_stn" "Efstrn" "Strn_p1" "Strn_p2" "Strn_p3"
Element_data IDM=3
"Porosity" "Elt_temp" "Elt_pore"
Elastic_state_variables IDM=1
"Young"
* History_surface NUM=1
Name "Cnt_cascem_avg_hgw"
Geometry_sets IDM=1
"Cnt_cascem_hgw"
Average_values IDM=8
C_strsnm
C_strsne
C_strstn
C_qprat
C_pslip
C_por_pr
C_temper
C_nrm_gn
Output_frequency_increment 1
Output_name_flag 1
Output_topology_flag 1
* History_surface NUM=2
Name "Cnt_cemfm_avg_hgw"
Geometry_sets IDM=1
"Cnt_cemfm_hgw"
Average_values IDM=8
C_strsnm
C_strsne
C_strstn
C_qprat
C_pslip
C_por_pr
C_temper
C_nrm_gn
Output_frequency_increment 1
Output_name_flag 1
Output_topology_flag 1
|
1History_point data named "Xaxis" has been defined to monitor selected variables (displacements, velocities, stresses, strains, pore pressure, temperature, etc.) at three points (two on the boundary, slightly inside, and one in the middle) along the x-axis (i.e. radial direction) for each of the wellbore components. An example of the three monitoring points for the cement is shown below.
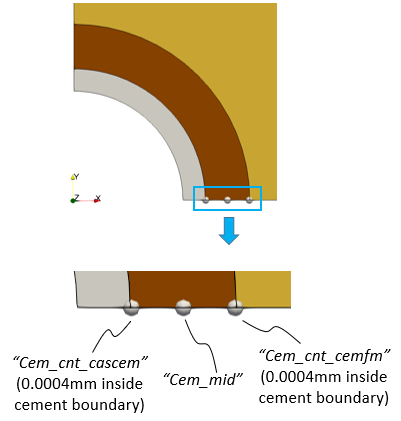
Three history monitoring points on the cement
2History_surface data to monitor selected average contact variables (stresses, slip, temperature, etc.) on the casing/cement and cement/formation interfaces have been defined for the hanging wall contacts.
|
Couple control data
Data File
|
|
* Couple_control_data
Solution_algorithm "Incremental"
Volume_strain_coupling "None"
Field_names IDM=3
"Geomechanical"
"Porous_flow"
"Thermal"
|
1Couple_control_data data structure to define the THM simulation for the three fields (i.e. geomechanical, porous flow and thermal field) are set as: a.Volume_strain_coupling set to "None" for the initialization stage. No change in parameters, e.g. pore pressure, displacements, porosities will contribute to the volume strain during the initialization stage. b.Incremental staggered solution strategy. |
Solution control data
Data File
|
|
* Porous_flow_control_data
Control_title "init"
Solution_algorithm 2
* Thermal_control_data
Solution_algorithm 2
* Control_data
Control_title "Pre-drill Init"
Duration 1.0
Solution_algorithm 4
Initial_time_increment 1.0
Target_number_time_steps 1
Screen_message_frequency 1
Output_frequency_plotfile -1
|
1During the initialization stage, the Porous_flow_control_data and the Thermal_control_data solution algorithm data can be defined as 2 for nonlinear static.
2The Control_data data structure for the pre-drill initialization stage can be defined to solve in one step since all external boundaries are constraint and stresses are in balance.
|
|
Constraint_relaxation data
Data File
|
|
* Constraint_relaxation
Displacement_geom_set IDM=6
"Casing_in"
"Cnt_cascem_ftw"
"Cnt_cascem_hgw"
"Cnt_cemfm_hgw"
"Cnt_cemfm_ftw"
"Top_cement"
Time_curve 200
* Time_curve_data NUM=200
Name "constrain_relax"
Time_curve IDM=2
1.0 11.0
Load_factor IDM=2
1 0
Curve_type 2
|
1The Constraint_relaxation data structure is applied to the inner casing wall, the top of the cement and the contact interfaces between the casing/cement and cement/formation. This enables the equivalent stress to replace the fixity conditions to be applied and gradually ramped down to zero over the stage duration.
2By default, an sramp function is used to relax the stresses, however, in this case, we will use a Time_curve_data to define an s-curve type (2) ramp to relax the stresses in order to be consistent with the load curve used to apply the mud stress.
|
Support_data
Data File
|
|
* Support_data
Displacement_codes IDM=3 JDM=4
1 0 0
0 1 0
0 0 1
1 1 0
Displacement_code_geom_set IDM=7
"Symm-x"
"Symm-y"
"Far-x"
"Far-y"
"Base"
"Top_casing"
"Top_formation"
Displacement_code_geom_ass IDM=7
1 2 1 2 3 3 3
Pore_pressure_codes IDM=1 JDM=1
1
Pore_pressure_code_geom_set IDM=2
"Far-x"
"Far-y"
Pore_pressure_code_geom_ass IDM=2
1 1
Temperature_codes IDM=1 JDM=1
1
Temperature_code_geom_set IDM=1
"All_volumes"
Temperature_code_geom_ass IDM=1
1
|
1Support_data is overwritten and the only difference compared to stage 1 is that the displacements at the inner casing wall, top of cement and at the contact surfaces are no longer constrained.
|
Couple freedoms
Data File
|
|
* Couple_freedoms NUM=1
Geomechanical_codes IDM=3
0 0 1
Geometry_sets IDM=1
"Top_cement"
|
1Couple_freedoms data is defined for the top of the cement surface to make sure all nodes have consistent vertical displacements.
|
Loading data
Data File
|
|
* Global_loads NUM=1
Name "Mud_Stress_cement"
Surface_load IDM=3 JDM=1
1 0 0
Surface_load_geom_set IDM=1
"Top_cement"
Surface_load_geom_ass IDM=1
1
* Time_curve_data NUM=1
Name "Mud_Stress_cement"
Time_curve IDM=2
1.0 11.0
Load_factor IDM=2
0 2.3E+07
Curve_type 2
* Global_loads NUM=2
Name "Mud_Stress_casing"
Surface_load IDM=3 JDM=1
1 0 0
Surface_load_geom_set IDM=1
"Casing_in"
Surface_load_geom_ass IDM=1
1
* Time_curve_data NUM=2
Name "Mud_Stress_casing"
Time_curve IDM=2
1.0 11.0
Load_factor IDM=2
0 2.3E+07
Curve_type 2
|
1Global_loads NUM=1 and 2 correspond to the application of mechanical load of the drilling mud ramped up to 23·106 Pa using an s-curve type (2) load ramp. This is applied to the top of the cement and the inner casing wall respectively.
Notes:
•Application of drilling mud load usually involves a mechanical component and a pore pressure component. In this example, since the drilling mud is applied to the inner wall of the casing which is defined as total stress with zero pore pressure and porous flow de-activated, only the mechanical component will be of consideration.
|
Couple control data
Data File
|
|
* Couple_control_data
Solution_algorithm "Incremental"
Volume_strain_coupling "Undrained"
Field_names IDM=3
"Geomechanical"
"Porous_flow"
"Thermal"
|
1Couple_control_data data structure is overwritten such that the Volume_strain_coupling is changed to "Undrained". |
Solution control data
Data File
|
|
* Porous_flow_control_data
Control_title "Drill"
Solution_algorithm 4
* Thermal_control_data
Solution_algorithm 4
* Control_data
Control_title "Drill_Casing_Cement_Install"
Duration 10
Solution_algorithm 4
Initial_time_increment 0.4
Target_number_time_steps 200
Screen_message_frequency 5
Output_frequency_plotfile -1
Output_frequency_restart -1
|
1During the drilling stage (and subsequent simulation stages), the Porous_flow_control_data and the Thermal_control_data solution algorithm data are defined as 4 to capture the nonlinear transient response.
2In the Control_data data structure for the drilling, cement hardening and start of injection stages, the Initial_time_increment is set to 0.4 (i.e. coupling time step of 0.4 time units) and Target_number_time_steps is set to 200, i.e. 200 mechanical steps per coupling step.
|
|
Support_data
Data File
|
|
* Support_data
Displacement_codes IDM=3 JDM=4
1 0 0
0 1 0
0 0 1
1 1 0
Displacement_code_geom_set IDM=8
"Symm-x"
"Symm-y"
"Far-x"
"Far-y"
"Base"
"Top_casing"
"Top_formation"
"Top_cement"
Displacement_code_geom_ass IDM=8
1 2 1 2 3 3 3 3
Pore_pressure_codes IDM=1 JDM=1
1
Pore_pressure_code_geom_set IDM=2
"Far-x"
"Far-y"
Pore_pressure_code_geom_ass IDM=2
1 1
Temperature_codes IDM=1 JDM=1
1
Temperature_code_geom_set IDM=1
"All_volumes"
Temperature_code_geom_ass IDM=1
1
|
1Support_data is overwritten and the only difference compared to stage 2 is that the displacements at the top of the (hardened) cement is now constrained vertically.
|
Loading data
Data File
|
|
* Load_case_control_data
Loadcases IDM=2
1 2
Active_load_flags IDM=2
0 2
|
1During this stage, the top of the cement is fixed vertically and the mud stress previously applied to the top of the cement (load 1) can be removed. Note that load 2 corresponds to the mud stress applied to the inner casing wall. |
Reference set data
Data File
|
|
* Reference_set_data NUM=1
Name "Cemhard"
Output_change 1
Groups IDM=3
"Casing3D"
"Cement3D"
"Formation"
Nodal_variables IDM=3
"Disp" "Pore_nod" "Temp_nod"
Element_variables IDM=17
"Porosity" "Effmean" "Vonmises"
"Strs_xx" "Strs_yy" "Strs_zz"
"Strs_p1" "Strs_p2" "Strs_p3"
"Vol_stn" "Efstrn"
"Strn_xx" "Strn_yy" "Strn_zz"
"Strn_p1" "Strn_p2" "Strn_p3"
|
1A Reference_set_data is defined at the start of the cement hardening stage so that the change in the specified variables during the cement hardening stage is output to the plot file. Because the data is named "Cemhard" the output variables will be named according to the following format: e.g. "Cemhard Delta Volumetric Strain". |
Solution control data
Data File
|
|
* Control_data
Control_title "Cement_hardening_start"
Duration 12
Solution_algorithm 4
Initial_time_increment 0.4
Target_number_time_steps 200
Screen_message_frequency 10
Output_frequency_plotfile -1
Output_time_plotfile 4.0
Output_frequency_restart -1
* Control_data
Control_title "Cement_hardening"
Duration 28
Solution_algorithm 4
Initial_time_increment 0.4
Maximum_time_increment 2.0
Transient_time_step_growth 1.04
Target_number_time_steps 200
Screen_message_frequency 10
Output_frequency_plotfile -1
Output_time_plotfile 14.0
Output_frequency_restart -1
|
Two sets of solution control data are utilised for the cement hardening stage:
1The first define the control data for the 12 hours of hardening where majority of the volume shrinkage occurs and is solved using a constant time increment of 0.4.
2The second define the control data for the next 28 hours of hardening with much reduced shrinkage. In this instance, a transient time step growth time increment definition is utilized for the solution control data. This requires three keyword data to be defined: a.Initial_time_increment = 0.4 - this defines the initial time step increment which is set same as the previous stage time increment. b.Maximum_time_increment = 2.0 - this defines the maximum time step increment permitted. c.Transient_time_step_growth = 1.04 - this defines the factor for which the time step increment will 'grow' from one step to the next.
|
|
Support_data
Data File
|
|
* Support_data
Displacement_codes IDM=3 JDM=4
1 0 0
0 1 0
0 0 1
1 1 0
Displacement_code_geom_set IDM=8
"Symm-x"
"Symm-y"
"Far-x"
"Far-y"
"Base"
"Top_casing"
"Top_formation"
"Top_cement"
Displacement_code_geom_ass IDM=8
1 2 1 2 3 3 3 3
Pore_pressure_codes IDM=1 JDM=1
1
Pore_pressure_code_geom_set IDM=2
"Far-x"
"Far-y"
Pore_pressure_code_geom_ass IDM=2
1 1
Temperature_codes IDM=1 JDM=1
1
Temperature_code_geom_set IDM=1
"Casing_in"
Temperature_code_geom_ass IDM=1
1
|
1Support_data is overwritten and the only difference compared to stage 3 is that the temperature for all volumes are no longer constrained apart from at the inner casing wall.
|
Loading data
Data File
|
|
* Global_loads NUM=3
Name "Temp_casing"
Prescribed_temperature IDM=1 JDM=1
1
Pres_temperature_geom_set IDM=1
"Casing_in"
Pres_temperature_geom_ass IDM=1
1
* Time_curve_data NUM=3
Name "Temp_casing"
Time_curve IDM=2
51.0 51.01
Load_factor IDM=2
132 72
Curve_type 2
* Load_case_control_data
Loadcases IDM=3
1 2 3
Active_load_flags IDM=3
0 2 2
|
1Global_loads NUM=3 corresponds to the temperature load (associated with injection loading) applied to the inner casing wall. The temperature is reduced from 132°C to 72°C using an s-curve type (2) load ramp over the stage duration.
Note that load 2 corresponds to the mud stress applied to the inner casing wall which is maintained in this stage.
|
Solution control data
Data File
|
|
* Control_data
Control_title "Injection_start"
Duration 0.01
Solution_algorithm 4
Initial_time_increment 0.0002
Target_number_time_steps 200
Screen_message_frequency 10
Output_frequency_plotfile -1
Output_time_plotfile 0.005
Output_frequency_restart -1
|
1The injection ramp up stage is solved using a constant time increment of 0.0002, i.e. 50 time increments for the stage.
|
|
Solution control data
Data File
|
|
* Control_data
Control_title "Injection_flow"
Duration 1.0
Solution_algorithm 4
Initial_time_increment 0.0002
Maximum_time_increment 0.01
Transient_time_step_growth 1.1
Target_number_time_steps 200
Screen_message_frequency 10
Output_frequency_plotfile -1
Output_time_plotfile 0.5
Output_frequency_restart -1
|
1During the final constant injection rate stage, a transient time step growth time increment definition is utilized for the solution control data. This requires three keyword data to be defined: a.Initial_time_increment = 0.0002 - this defines the initial time step increment which is set same as the previous stage time increment. b.Maximum_time_increment = 0.01 - this defines the maximum time step increment permitted. c.Transient_time_step_growth = 1.1 - this defines the factor for which the time step increment will 'grow' from one step to the next.
|
|
The result files for the project are in directory: ParaGeo_Tutorial_Examples\Wellbore_001\Case01\Results.
The results below show the temperature distribution in the wellbore model at various stages of the simulation.

Temperature distribution in the wellbore model at various times
The results below show the volumetric strain distribution in the wellbore model at various stages of the simulation. Shrinkage (negative volumetric strain) of the cement is observed at the end of stage 3 (cement hardening) due to diagenetic reaction. Further reduction in temperature (cooling) from 132°C to 72°C during the injection stages 4 and 5 on the inner casing wall results in further shrinkage of the cement and contraction of the casing.
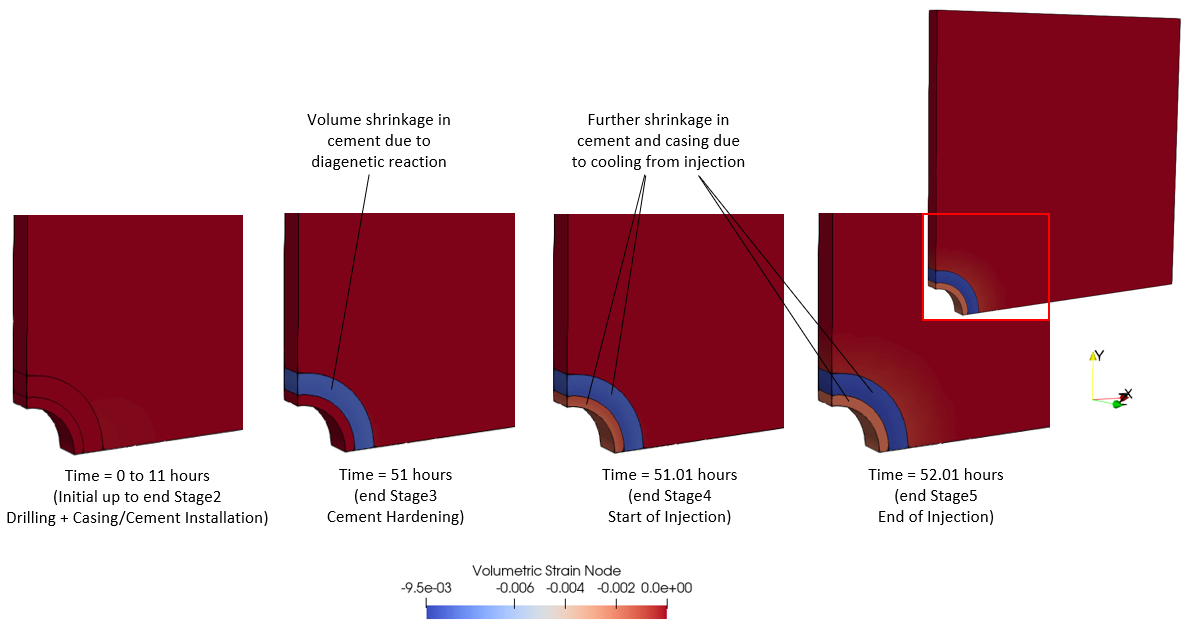
Volumetric strain distributions in the wellbore model
The results below of the displacement vectors at the end of the cement hardening stage highlights the cement shrinkage.
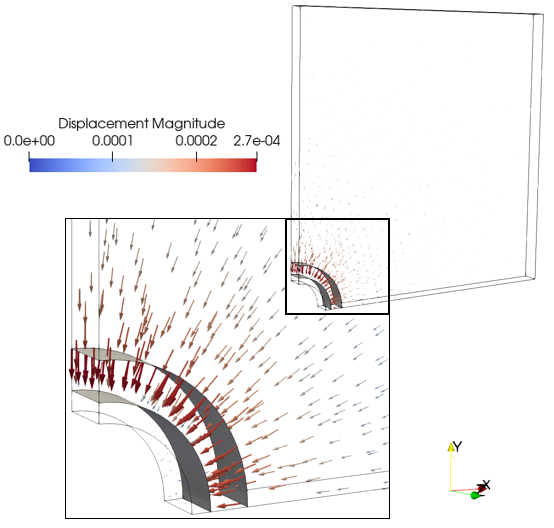
Displacement vectors at the end of cement hardening stage
The timings for the various stages are summarized in plot (a) below. Also shown in (a) are the monitoring points in the cement and formation from which the graphical plots (b and d) of stresses and strains are presented. Contact stresses at the cement/formation interface are shown in (c).
Plots of stresses and strains (b) primarily shows:
•Stage 2 Drilling + casing/cement installation phase: During drilling, the volume strain in the cement is shown to slightly increase with corresponding reduction in effective mean stress. Note that as the cement is assigned low deviatoric strength (to approximate its fluid state), the deviatoric stress is very low.
•Stage 3 Cement hardening: othe von Mises yield strength of the cement is increased from the slurry yield strength 20·103 Pa to a 'hardened' yield strength of 50·106 Pa. odiagenetic reaction during the cement hardening process resulting in porosity change independent of temperature causes c.a. 0.09% bulk shrinkage in the cement as observed by the decrease in the volume strain plot (b-vi).
A consequence of the cement shrinkage is a reduction in the contact stresses as observed in the average contact normal total stress plot (c). This reduction in contact stresses allows elastic expansion of the cement which partially compensates for the cement shrinkage. In turn, this elastic expansion results in a reduction in the effective mean stress as observed in plot (b-i).

(a) Description of simulation stages and associated timings and monitoring points in cement and formation for graphical plots below
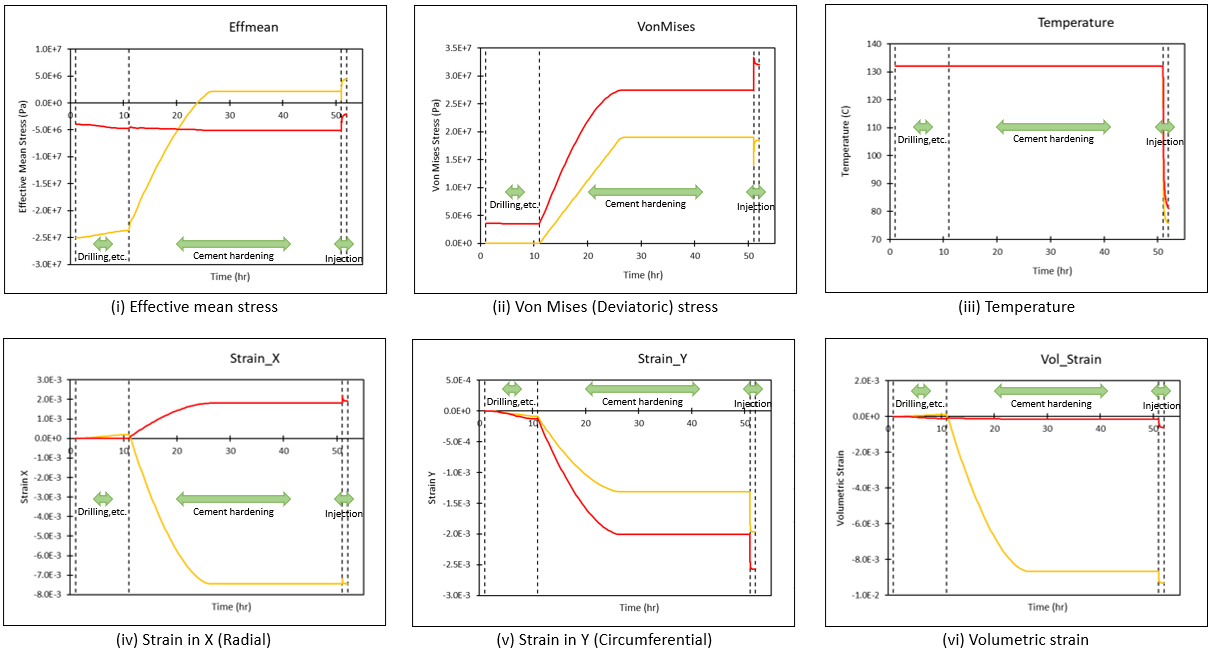
(b) Plots of stresses and strains in the cement and formation monitoring points
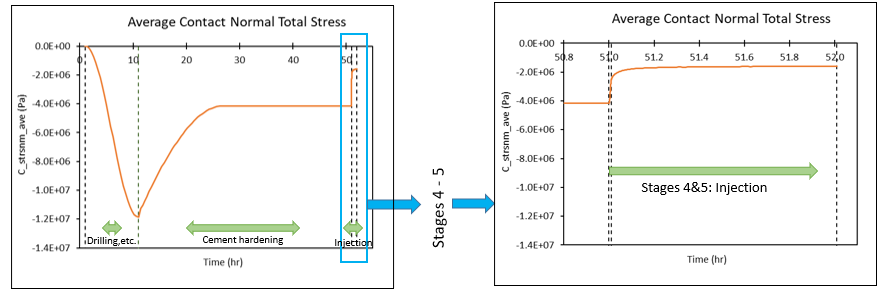
(c) Plots of average contact normal total stresses at the cement/formation interface
•Stage 4 and 5 Injection: During stages 4 and 5 injection, the temperature at the casing inner wall is reduced from 132°C to 72°C. Over time, the reduced temperature front gradually reaches the cement and formation monitoring points and its influence on the stresses and strains are shown in plot (d) below. The main observations from the temperature reduction are decrease in volumetric strain and increase in effective mean stress.
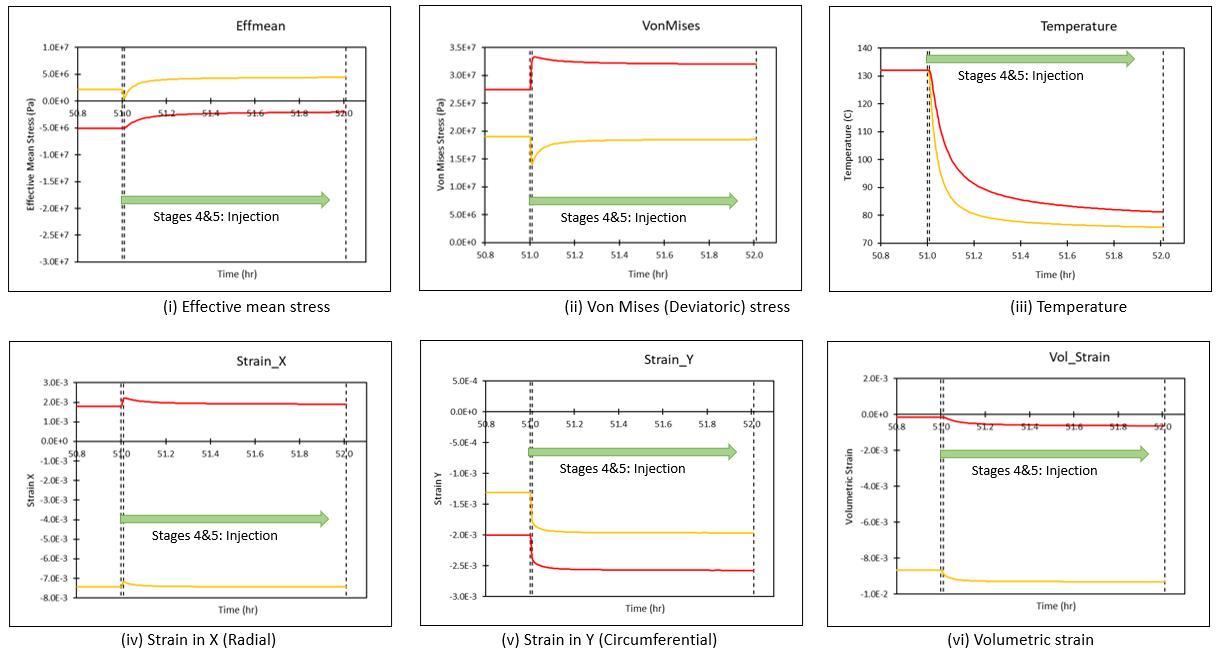
(d) Plots of stresses and strains in the cement and formation monitoring points from start till end of simulation
|


