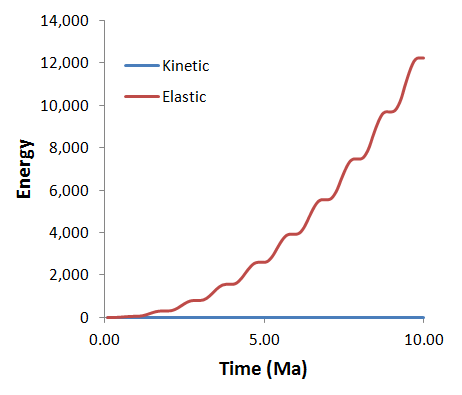
The initial data file for the project is: mech_002\Data\mech_002_Case1.dat. The basic data includes:
1A single group which is assigned the "KWC" properties defined using Group_control_data and Group_data data structures. The Porous_flow_type = 5 i.e. a drained effective stress, which corresponds to a drained saturated porous material where pore pressure is not specified. 2Material properties (Material_data) for "KWC" exported from material database training.mdb using the "Set data for geomechanical only" option. 3Fluid properties (Fluid_data) for water. Fluid properties are necessary for an effective stress analysis to compute the influence of buoyancy on the gravity load. 4Time scaling data (Time_scaling_data) with target time step 1E-4s (see Mech_002). 5Global damping (Damping_global_data) with 2% percentage damping (see Mech_002). 6Support data (Support_data) defining line 1 as fixed vertically and and lines 2 and 4 as fixed horizontally. 7Mesh control (Mesh_control) and Unstructured mesh generation data (Unstructured_mesh_data) defining a constant mesh size of 20m (see Mesh_001). 8Adaptivity control (Adaptivity_control_data) and adaptivity set data (Adaptivity_set_data) specifying a remeshing check every 500 steps and a constant target element size of 20m. Adaptivity is compulsory when using the layer sedimentation procedure (see Mech_004). 9Global history (History_global) and point history (History_point) data. A single point is defined at the base of the sediment column (see Mech_001). 10Control data (Control_data) defining: (a) Transient solution algorithm (Type 1), (b) Termination time of t=1.0 Ma, (c) Factor of critical time step = 0.9 i.e. lower than the default value, (d) Plot file output every 0.5 Ma,
Each stage (step) of the analysis is terminated by a Control_data data structure that defines the solution, output and termination data for the stage. Multiple stages therefore require multiple Control_data keywords, with the data modifications for each stage defined prior to the Control_data keyword for the stage. This is demonstrated in the pseudo data file below.
Data File
|
|
Data for Stage 1
* Control_Data
* Sedimentation_data
* Control_Data
* Sedimentation_data
* Control_Data
Continue for all nine stages
|
1For this case a total of 10 stages are used; one for initialisation of the pre-existing sediment and nine for deposition of the new layers. 2The deposition of each new layer is defined using the Sedimentation_data data structure. 3The Control_data then defines that the stage duration for the deposition step will be 1.0 Ma. 4Consequently each stage is defined by a Sedimentation_data data structure followed by a Control_data data structure. 5Once a Control_data data structure is read, further processing of the data file is suspended until the analysis for that stage has been completed. |
|
The stratigraphy associated with the initial sediment must be defined when the layer sedimentation procedure is used. This requires
1Defining the existing stratigraphy layer depositional order and the group associated with each layer (via Stratigraphy_definition). 2Defining the topology of the top surface horizon for each stratigraphy layer (via Stratigraphy_horizon).
Stratigraphy_definition
The stratigraphy order is specified in order starting from the deepest sediment layer. Each stratigraphy layer must comprise a single group (see Group_data). It is recommended that, for each layer, the stratigraphy unit name, stratigraphy horizon name and group name are identical. This greatly simplifies data definition and result interrogation, especially when the number of stratigraphy layers becomes large. If this convention is adopted, ParaGeo will internally identify the required associations between unit, horizons and groups, so that only the unit order is specified on the Stratigraphy_definition data structure.
Data File
|
|
* Stratigraphy_definition
Unit_Names 1
"KWC"
|
1Only one layer is present in the initial model. 2In general ParaGeo allows different names to be used for the Group, Stratigraphy Horizon and Stratigraphy Unit. In this case in addition to Unit_names the Stratigraphy Horizon Number (Horizon_numbers) and Group number (Group_numbers) for each unit must be provided. 3In this case consistent naming of the group "KWC", horizon "KWC" and unit "KWC" is adopted. Consequently so only the unit order is required and the Unit->Group->Horizon association is automatically established by ParaGeo.
|
Stratigraphy_horizon
The stratigraphy horizon defines the top surface of each pre-existing stratigraphy unit. It is defined by a set of geometry lines in 2-D or a set of geometry surfaces in 3-D. A Stratigraphy_horizon data structure must be defined for each stratigraphy unit.
Data File
|
|
* Stratigraphy_horizon NUM=1
Name "KWC"
Lines IDM=1
3
|
1The stratigraphy horizon for unit "KWC" must be defined. 2For consistency it is also named "KWC". 3The top surface of the unit is defined by geometry line 3. |
|
Layer sedimentation is defined using two data structures:
1Sedimentation_data which defines the control data for deposition of a single layer; e.g. unit name, material, sedimentation type, etc. 2Sedimentation_horizon which defines the target topology for the stratigraphy horizon of the new layer.
Note that a Stratigraphy_horizon is an existing horizon defined by geometry entities (lines 2-D, surfaces 3-D) that form part of the model, whereas a Sedimentation_horizon is a faceted surface that is not connected with the model. During layer sedimentation new geometry entities are created to define the new layer, and the Stratigraphy_horizon for the new layer is formed using a combination of these new geometry entities and pre-existing geometry (if required).
Sedimentation_Data
Sedimentation_data is the primary data structure for definition of sedimentation of a new stratigraphy unit. One data structure is required for each new layer and the sedimentation process is associated with a single analysis stage (step). Consequently in the current problem, where nine additional layers are deposited on the pre-existing layer, the analysis consists of ten steps. The principal data includes:
1The name of the new stratigraphy layer (Stratigraphy_unit_name). 2The sedimentation horizon name (Sediment_horizon_name); i.e. the Sedimentation_horizon to be used in defining the top surface of the new layer. 3The name of the material properties to be used for the new material (Material_name). 4The duration (Duration) of the initialisation of gravity loading for the new layer. This is generally set to less than the time for the stage so that additional dynamic relaxation can occur prior to deposition of the next layer.
By default, the Sedimentation_type is "Absolute" where the Sedimentation_horizon defines the top surface of the new layer. Two alternative sedimentation types are available:
1"Relative" - where a sedimentation horizon defines the topology of the new top surface but its location is defined via a layer thickness (Reference_thickness) and reference location (Reference_location). The sedimentation horizon is then positioned so the vertical thickness is correct at the reference location. 2"Drape" - Where a uniform thickness of material is added across the complete model. In this case only the thickness of the layer (Reference_thickness) is required.
Data File
|
|
* Sedimentation_data
Stratigraphy_unit_name "KWC2"
Sediment_horizon_name "General"
Material_name "KWC"
Duration 0.8
|
The sedimentation data for stratigraphy layer 2 is defined before the Control_data for Stage 2 as:
1Unit "KWC2" with a top surface horizon defined by the Sedimentation_horizon_name "General". 2The material properties are "KWC"; i.e. the same as the pre-existing sediment. 3The gravity for the new layer is applied over 0.8Ma which is less than the total time for stage 2 which is 1.0Ma. 4Note that the "General" sedimentation horizon is used for creation of all nine layers. |
Sedimentation_Horizon
The Sedimentation_horizon data structure defines the topology of a top surface horizon for sedimentation of a new stratigraphy layer. The horizon is defined as a faceted surface; i.e. 2-noded facets in 2-D, 3-noded facets in 3-D. The node numbering and coordinates defining the faceted surface are defined in the data structure and do not form part of the nodes in the mesh. The horizon may be defined as either stationary or moving; e.g. increasing in elevation or prograding, via a displacement component magnitudes and a time curve. A sedimentation horizon may be used to define more that one layer; e.g. a prograding horizon is often used to define sedimentation of all layers. Alternatively multiple sedimentation horizons may be specified and used for sedimentation of individual layers.
Data File
|
|
* Sedimentation_horizon NUM=1
Name "General"
Facet_topology IDM=2 JDM=1
1 2
Coordinates IDM=2 JDM=2
0.0 200.0
60.0 200.0
Time_curve 1000
Displacement IDM=2
0.0 2000.0
* Load_curve_data NUM=1000
Time_curve IDM=2
0 10
Load_factor IDM=2
0 1
|
1A single moving sedimentation horizon named "General" is defined. 2The horizon is defined by a single facet with two nodes at locations:
Node
|
X-Coordinate
|
Y-Coordinate
|
1
|
0.0
|
200.0
|
2
|
60.0
|
200.0
|
3A reference displacement of 2000m in the vertical direction is defined. 4Load curve 1000 is assigned that defines that the full vertical displacement of the surface will be achieved after 10 Ma. |
|
The Gravity_data data structure identifies that gravity is active in the problem and defines the magnitude of the gravitational constant. Gravity can be applied either instantaneously; i.e. with geostatic initialisation, or may be assigned a load curve to allow a gradual increase of gravity with time. When new layers are sedimented, gravity should be ramped up slowly over the deposition stage. Depending on the specific application, either a linear ramp or an S-Curve (smoothly varying ramp) is used.
When solving problems in metric units the gravitational constant should be specified in m/s2 (even if the units are mm) provided the problem or material units are specified. If no units are specified then care has to be taken to define material density and the gravitational constant to be consistent with the geometry definition.
By default the load curve associated with Gravity_data is also used during sedimentation of new layers, but with the Time_curve automatically adjusted based on the sedimentation duration (see Duration on the Sedimentation_data data structure).
Data File
|
|
* Gravity_data
Gravity_constant 9.810
Load_curve 100
* Time_curve_data NUM=100
Time_curve IDM=2
0.0 1.0
Load_factor IDM=2
0.0 1.0
Curve_type 2 ! S-Curve
|
1The gravitational constant is specified as 9.81 m/s2. 2Gravity loading is ramped up over 1.0 Ma using an S-curve. |
|
Material grids are uniform grids that can be superimposed on the finite element mesh. Once active, the grid deforms with the mesh and therefore gives an indication of the distortion of the model. They are particularly useful in visualisation of localised deformation; i.e. shear bands and faults. They are often defined in the initial configuration but can also be defined part-way through an analysis; i.e. when new material is sedimented. The compulsory data for Material_grid_set comprises:
1A list of groups, specified by name (Group_names) or number (Groups), for which material grids should be generated. An individual grid is generated for each group. 2The division size (cell size) for the group. The division size in the x-direction (Division_size_x) must be specified and by default the division size in the Y-direction is identical. 3The grid origin (Grid_origin) - which in 2-D is the X and Y coordinates of the lower left hand corner of the grid.
The Deposition_flag is also set for the Material_grid_set. This indicates that a new material grid should be created using this data for each newly deposited layer.
Contour values that define stripes when post-processed may also be output, via Stripe_spacing_x and Stripe_spacing_y. These provide an effective visualisation option that may be displayed with or without the underlying grid in ParaView. Material grids can be visualized by loading the grid plot file filename_grid.xmf
Data File
|
|
* Material_grid_set NUM=1
Group_names NUM=1
"KWC"
Deposition_flag 1
Division_size_x 10.0
Grid_origin IDM=2
0.1
0.1
Stripe_spacing_x IDM=2 JDM=1
1 1
|
1The material grid set is applied to group "KWC". 2The material grid set is also applied to all new deposited layers (Deposition_flag=1). 3The division size is 10.0m. 4The bottom left hand corner of the grid is located at X=0.1, Y=-0.1. 5Horizontal stripes are output to the plot file where both stripe widths are one cell.
|
|
|

